


![[Gamma] Scalping Please](https://ibkrcampus.com/wp-content/smush-webp/2024/04/tir-featured-8-700x394.jpg.webp "[Gamma] Scalping Please")


Off-exchange U.S. equity volumes have increased significantly in recent years, trading over 4.6 billion shares in April 2023. In a previous analysis, Cboe’s North American Equities Execution Consulting team explored the relationship between high volatility and the increase in trading reported to the Trade Reporting Facilities (TRF). Since then, we have also seen that sub-dollar trading increased as a result of increased retail participation during periods of high volatility, such as through the meme stock phenomenon. The increase in sub-dollar trading has created a misconception that off-exchange volumes are also primarily sub-dollar trades. To further understand the increase in off-exchange volumes, we analyzed how market share trends of U.S. equity off-exchange trading are impacted at different symbol price points.
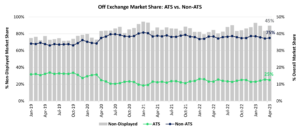
By offering features such as counterparty selection, greater anonymity, reduced market impact, and simplicity, off-exchange venues have created an alternative to executing trades on-exchange. Figure 1 below shows that TRF market share holds 45% of overall market volume as of April 2023. According to the TRF data published by FINRA, off-exchange volume can be classified into two market participant-type categories: Alternative Trading Systems (ATS) and Non-ATS Over the Counter (OTC). ATSs are venues similar to equity exchanges, that match various buyers and sellers of securities, also known as subscribers, making the venue participation multilateral. On the other hand, non-ATS OTC venues are bilateral, including venues such as single dealer platforms, wholesalers, central risk books and traditional high touch broker crossing/capital commitment. Currently, the non-ATS execution data does not provide any further clarity to the types of venues. Moreover, these venues do not have regulatory filing requirements specific to their operations. Increased transparency into the types of venues represented off-exchange could create a fairer competitive landscape and provide a better understanding of how these venues accept, handle, and/or execute trades.
Source: FINRA, SIP
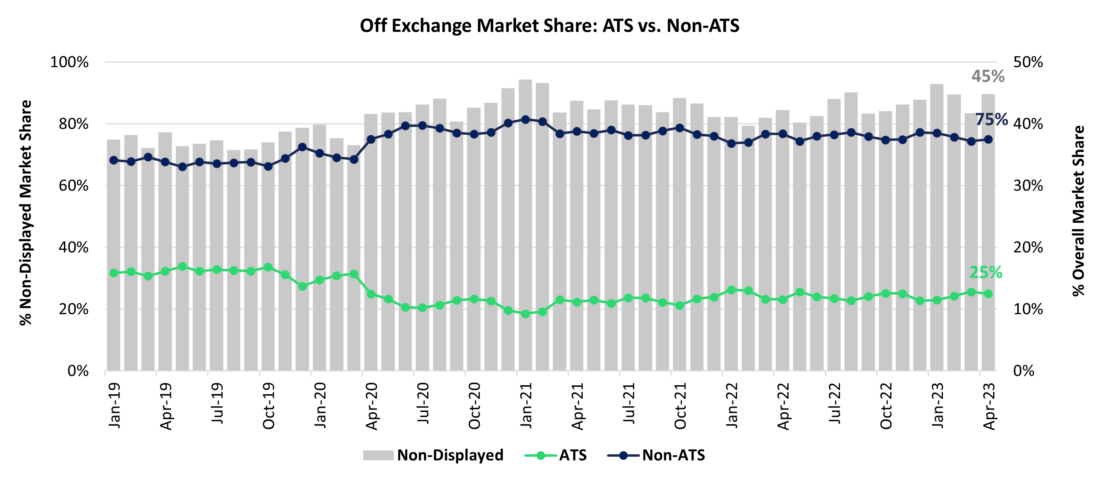
In April 2020, ATS market share of total off-exchange volume began decreasing, resulting in off-exchange trading to be less impacted by ATS activity. As of April 2023[1], ATS market share held 25% of total off-exchange volume. Thus, despite the growth in broker OTC trading, as seen below, ATS volume has remained flat.
Source: FINRA
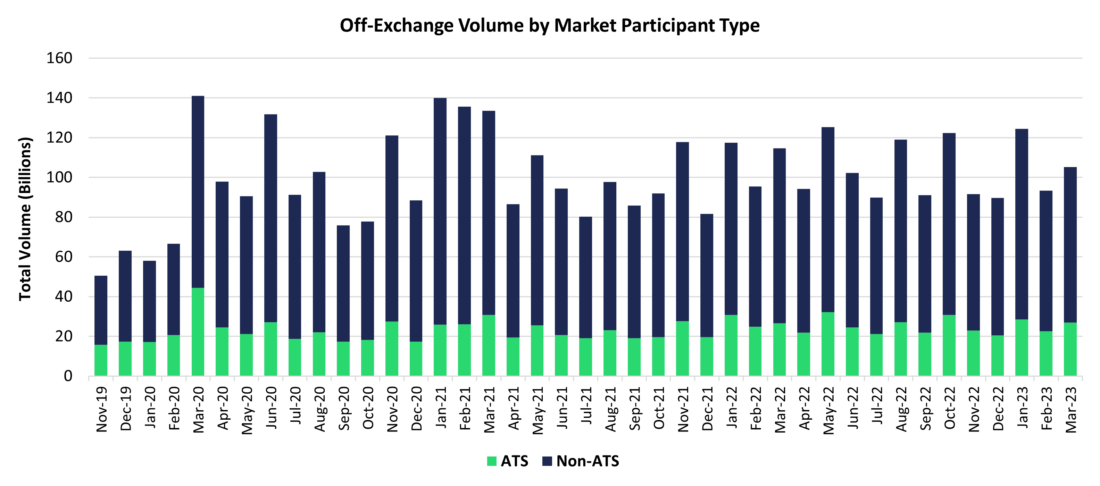
When assessing off-exchange activity at different symbol price points, the chart below suggests that as the security price bucket increases, non-ATS market share as a percent of total off-exchange volume decreases, while the market share for ATSs increases. Nonetheless, we continue to see that throughout all security price groups, off-exchange trading is concentrated largely in non-ATS volumes, which is reflective of ATS participation being a smaller portion of off-exchange trading overall.
Source: FINRA, SIP
Market Share by Price Group
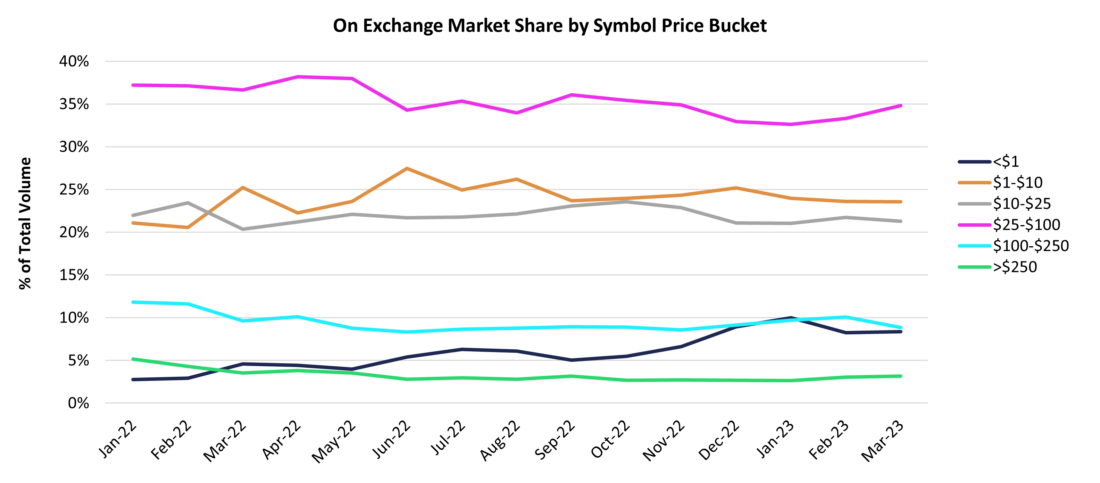
To better understand off-exchange liquidity at different price groups, it is important to get a holistic view of the market by understanding the composition of different price groups both on and off-exchange. We can begin by examining the chart below, which displays market share by price bucket as a percentage of total on-exchange volume, after excluding TRF activity. As of March 2023, sub-dollar trading represented 8.84% market share as a percent of total on-exchange volume (excluding TRF activity), reaching its peak in January 2023 at 10.01%. In addition, shares in the price groups ranging from $1-$100 tend to hold the highest market share, with an average cumulative market share of 81.34%as a percentage of total on exchange volume since January 2022. Thus, despite sub-dollar trading increasing, we can see that most of the volume on-exchange comes from shares priced between $1 and $100.
Source: FINRA, SIP
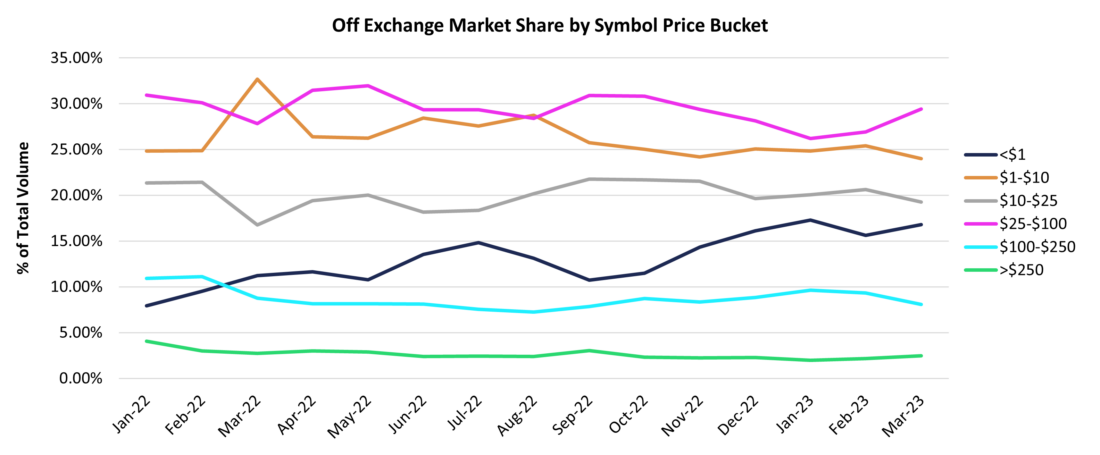
The trends in different price groups off-exchange mirror those seen on-exchange. For example, sub-dollar trading off-exchange has also increased since January 2022, with a 16.80%market share as a percent of total off-exchange volume in March 2023. Similar to the observations on-exchange, shares in price groups ranging from $1-$100 tend to hold the highest market share, with a cumulative market share of 72.67% as a percentage of total on exchange volume as of March 2023. Overall, the data shows that off-exchange trading is still primarily non-sub-dollar trading.
Source: FINRA, SIP
Off-Exchange Market Share by Market Participant
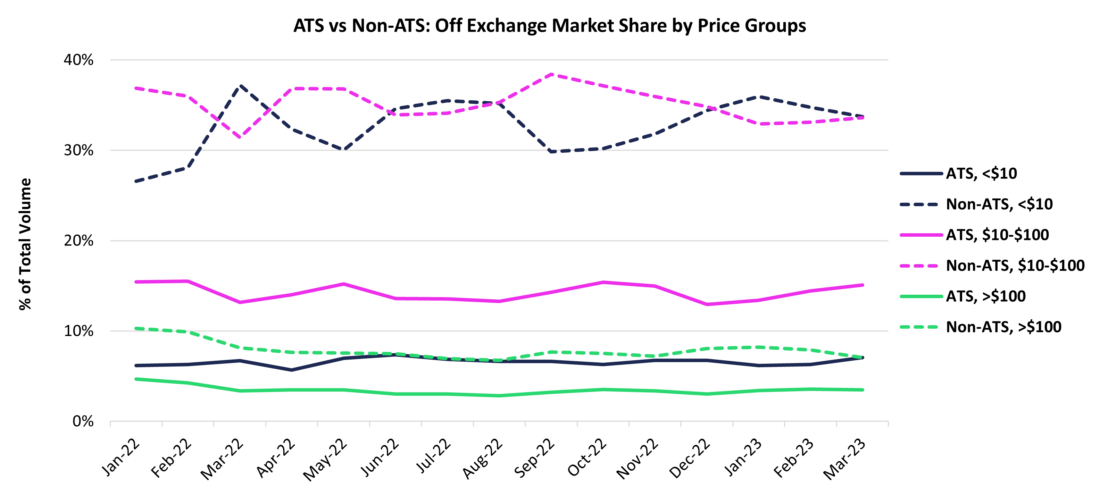
Despite ATS participation increasing as the share per price bucket increases, it is important to consider the proportion of each price bucket relative to total off-exchange volume. The chart below demonstrates that throughout all price groups, ATS market share has historically been less than the market share of non-ATSs of the same price bucket. In addition, for shares greater than $100, ATS market share was 3.47%of total off-exchange volume in March 2023. Therefore, even though ATS participation increases as the price bucket increases, this does not equate to ATS liquidity increasing. As referenced previously, ATS volume has remained flat, making liquidity difficult to source off-exchange and resulting in the inability for all market participants to interact on ATSs. With liquidity on ATSs remaining relatively flat over the past few years, searching for additional liquidity to ATSs is necessary. Periodic Auctions provide an opportunity for investors to find liquidity as an alternative to off-exchange trading.
Source: FINRA, SIP
Periodic Auctions
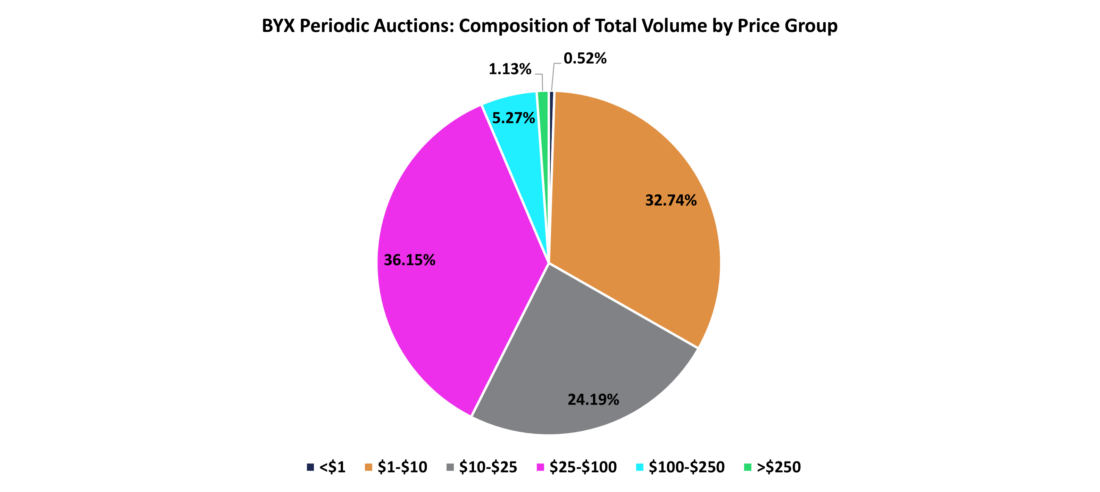
Cboe’s Periodic Auctions allow for on-exchange trading that provides members an alternative to non-ATSs, with the benefits of minimizing market impact from block size transactions and finding liquidity within a short period. In the pie chart below, shares within price groups ranging from$1-$100, hold 93.07%of market share as a percentage of total volume at the time of execution, indicating that shares within these price groups are the most traded using Cboe’s Periodic Auctions. Thus, the composition of Periodic Auctions by price group follows similar trends both on and off-exchange.
Source: Cboe
To understand how Periodic Auctions provide the benefits of liquidity from block size transactions, the chart below compares the average trade size of ATSs vs Periodic Auctions. Throughout all quarters there is greater liquidity of block-sized trading within Periodic Auctions than that of ATSs off-exchange.
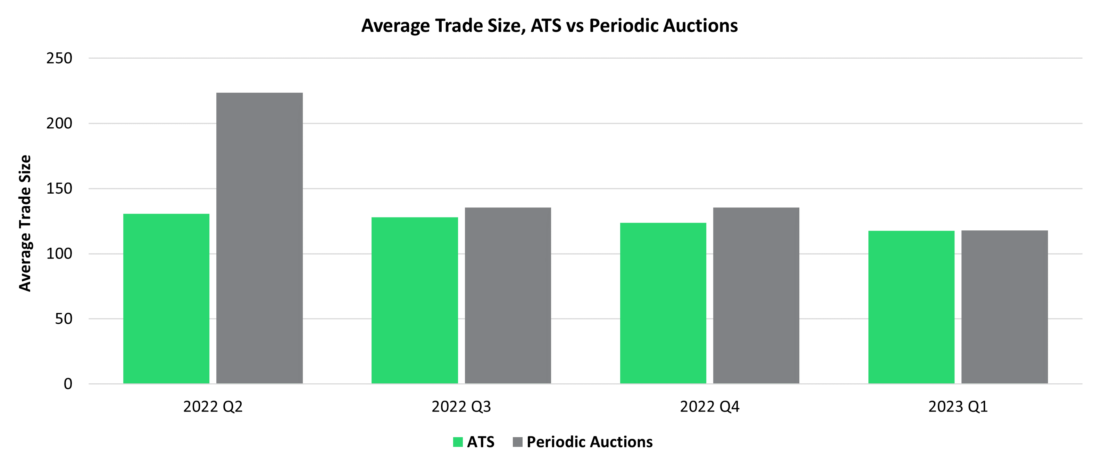
Source: FINRA, Cboe
The execution performance of orders traded under Periodic Auctions is more stable than orders executed in the continuous BYX book. As evidenced by the chart below, for orders executed in the continuous book, as execution time increases, post-trade markouts decrease. However, for orders executed in Periodic Auctions, post-trade markouts are stable throughout all execution times. This affirms that investors are better protected from adverse selection using Periodic Auctions, where future prices are more consistent and the spread after a few seconds is better-performing than those found on the continuous book.
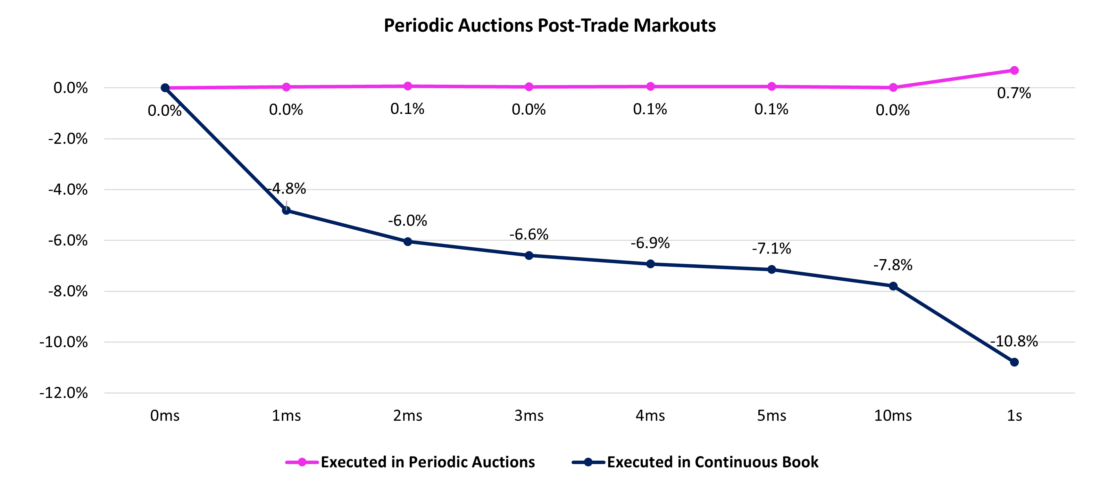
Source: Cboe
As we continue to learn more about the significant rise of off-exchange volume, it is important to reflect on how these non-displayed venues have created new competition dynamics across the market. Exploring off-exchange trends and advantages allows the opportunity to better understand investors and their needs in execution performance. Innovation of functionality and competitive pricing attract order flow to exchanges, either as maker-taker or inverted venues. Hence, to improve investors’ market participation experience and execution quality, Cboe’s Periodic Auctions may provide a useful on-exchange alternative to off-exchange trading, providing liquidity to wider spread stocks, block-sized trading, and protecting investors from adverse selection.
Please reach out to Cboe’s North American equities coverage team with questions and to learn about how we can help optimize your trading experience.
—
Originally Posted May 17, 2023 – Off-Exchange Trends: Beyond Sub-dollar Trading
There are important risks associated with transacting in any of the Cboe Company products or any digital assets discussed here. Before engaging in any transactions in those products or digital assets, it is important for market participants to carefully review the disclosures and disclaimers contained at: https://www.cboe.com/us_disclaimers/. These products and digital assets are complex and are suitable only for sophisticated market participants. These products involve the risk of loss, which can be substantial and, depending on the type of product, can exceed the amount of money deposited in establishing the position. Market participants should put at risk only funds that they can afford to lose without affecting their lifestyle. © 2023 Cboe Exchange, Inc. All Rights Reserved.
Disclosure: Cboe Global Markets
Options involve risk and are not suitable for all investors. Prior to buying or selling an option, a person must receive a copy of Characteristics and Risks of Standardized Options. Copies are available from your broker, or at www.theocc.com. The information in this program is provided solely for general education and information purposes. No statement within the program should be construed as a recommendation to buy or sell a security or to provide investment advice. The opinions expressed in this program are solely the opinions of the participants, and do not necessarily reflect the opinions of Cboe or any of its subsidiaries or affiliates. You agree that under no circumstances will Cboe or its affiliates, or their respective directors, officers, trading permit holders, employees, and agents, be liable for any loss or damage caused by your reliance on information obtained from the program.
Copyright © 2023 Chicago Board Options Exchange, Incorporated. All rights reserved.
Disclosure: Interactive Brokers
Information posted on IBKR Campus that is provided by third-parties does NOT constitute a recommendation that you should contract for the services of that third party. Third-party participants who contribute to IBKR Campus are independent of Interactive Brokers and Interactive Brokers does not make any representations or warranties concerning the services offered, their past or future performance, or the accuracy of the information provided by the third party. Past performance is no guarantee of future results.
This material is from Cboe Global Markets and is being posted with its permission. The views expressed in this material are solely those of the author and/or Cboe Global Markets and Interactive Brokers is not endorsing or recommending any investment or trading discussed in the material. This material is not and should not be construed as an offer to buy or sell any security. It should not be construed as research or investment advice or a recommendation to buy, sell or hold any security or commodity. This material does not and is not intended to take into account the particular financial conditions, investment objectives or requirements of individual customers. Before acting on this material, you should consider whether it is suitable for your particular circumstances and, as necessary, seek professional advice.


Join The Conversation
If you have a general question, it may already be covered in our FAQs. If you have an account-specific question or concern, please reach out to Client Services.