


This research article was originally posted at Finominal.
What is driving CTA performance?
SUMMARY
- CTAs pursue trends across asset classes, regardless if long or short
- 2022 is exceptional as CTAs have more short positions than during the GFC
- No single long bond index position remains, fixed income is one big short
INTRODUCTION
In our last research article (read Creating a CTA from Scratch – I) we demonstrated that building a CTA strategy is not particularly difficult. All it takes is a broad set of asset classes, a trend following methodology, and a portfolio construction model. We chose 59 indices that can be traded via futures contracts, the 12-month rolling return as a trading signal, and a simple equal-weighting with leverage to achieve a target volatility.
The do-it-yourself (DIY) CTA Strategy had a correlation of 0.6 to the SG CTA Index, which is one of the benchmark indices for the managed futures industry. The entire backtest was completed in Excel and took less than 3 hours, so we could likely achieve a higher correlation with more time and effort, or a different approach like creating a replication index via factor exposure analysis.
However, the DIY CTA strategy is good enough to investigate what has been driving CTA performance. Managed futures products have been labeled as black-box strategies as their portfolios change constantly, which tends to confuse investors.
In this research article, we will explore the performance drivers of CTAs.
SG CTA INDEX VS DIY CTA STRATEGY
When we created the DIY CTA Strategy, we ensured that the assumptions were reasonable from an implementation perspective, but ignored costs. In terms of making the backtest more realistic, we assume a management fee of 2% and a performance fee of 20% above a high watermark, as well as 0.10% transaction costs per trade. Rebalancing occurs on a monthly basis.
Contrasting the performance of the SG CTA Index and DIY CTA Strategy highlights a similar return in the period from 2000 to 2022. In some years the performance was almost identical, while somewhat different in others. The differences are likely explained by the universe of tradable assets and portfolio construction.
- Universe of tradable assets: Sophisticated CTAs trade up to 200 markets, which includes esoteric ones like electricity and cryptocurrencies, compared to 59 markets in the DIY CTA Strategy.
- Portfolio construction: We simply average across the returns of the markets within each of the four asset classes, but then leverage the allocations to the asset classes (bonds, equities, commodities, and currencies), so that the overall portfolio volatility matches that of the SG CTA Index. Most CTAs have more complex portfolio construction models and allocate capital based on the volatility of each market rather than on the asset class level.
It is worth highlighting that many CTAs have become less volatile over time as investors dislike large swings, which has led many funds to introduce target volatility ranges.
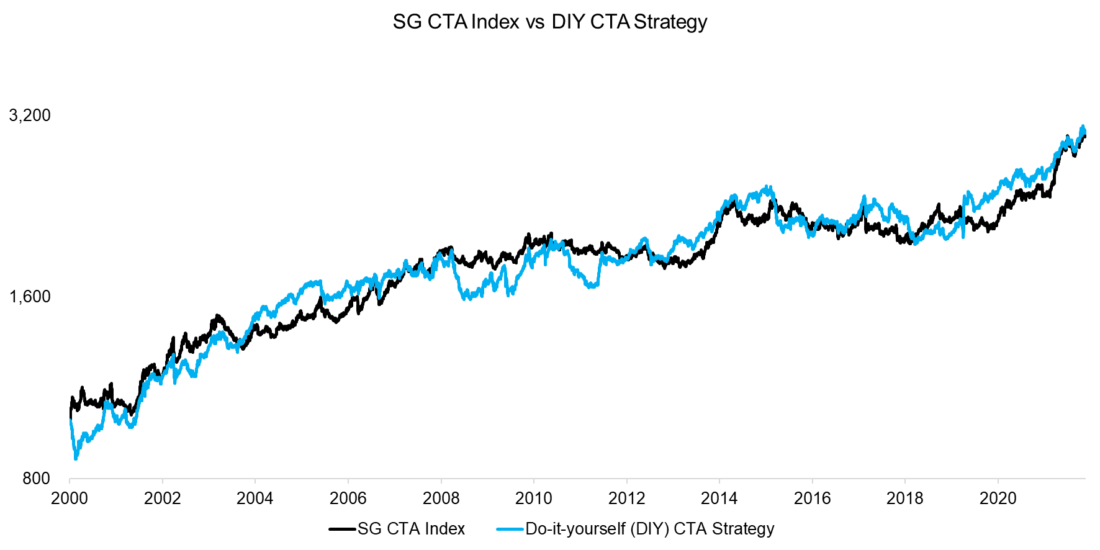
Source: Societe Generale, Finominal
BREAKDOWN BY ASSET CLASSES
First, we review the breakdown by asset classes of the long portfolio in the period from 2002 to 2022, which represents the aggregate exposure to markets where trends were positive and long positions were entered.
The DIY CTA Strategy had an average long exposure of 79% to various bond markets during the last 20 years, compared to 66% for equities, 59% for commodities, and 49% for currencies. Given that bond and stock markets were mostly rising through this period, this exposure is unsurprising. There was also a bull market in commodities fueled by the rise of the Chinese economy, but also a long bear market between 2012 to 2020.
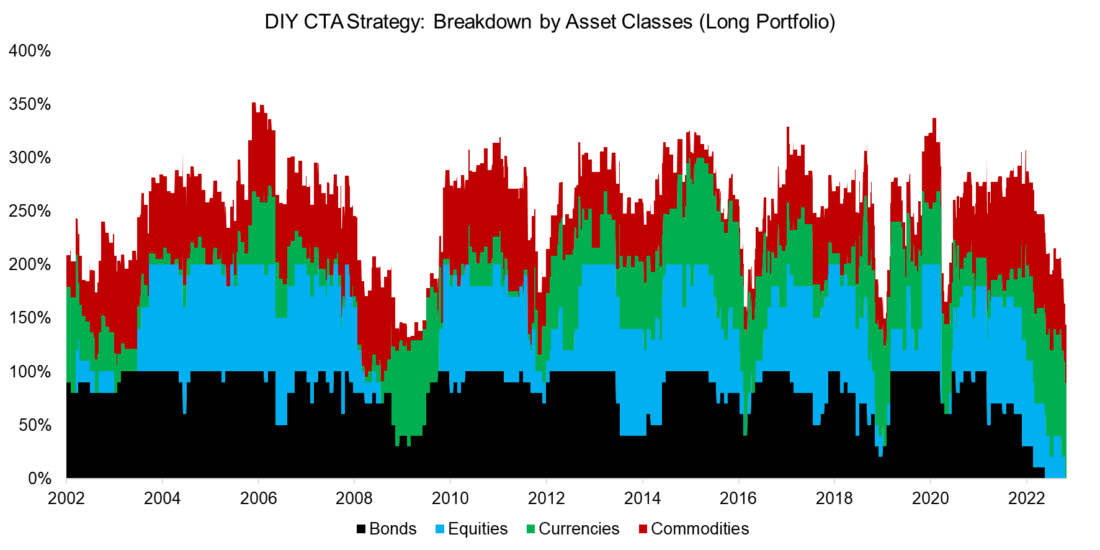
Source: Finominal
The short portfolio of the DIY CTA Strategy was dominated by currencies (51%), followed by commodities (41%), equities (34%), and bonds (21%).
Although bonds were primarily found in the long portfolio historically, this has changed in 2022 given rising interest rates and falling bond prices. For the first time in 20 years, there is not a single long position left and the DIY CTA Strategy is shorting all 11 fixed income markets.
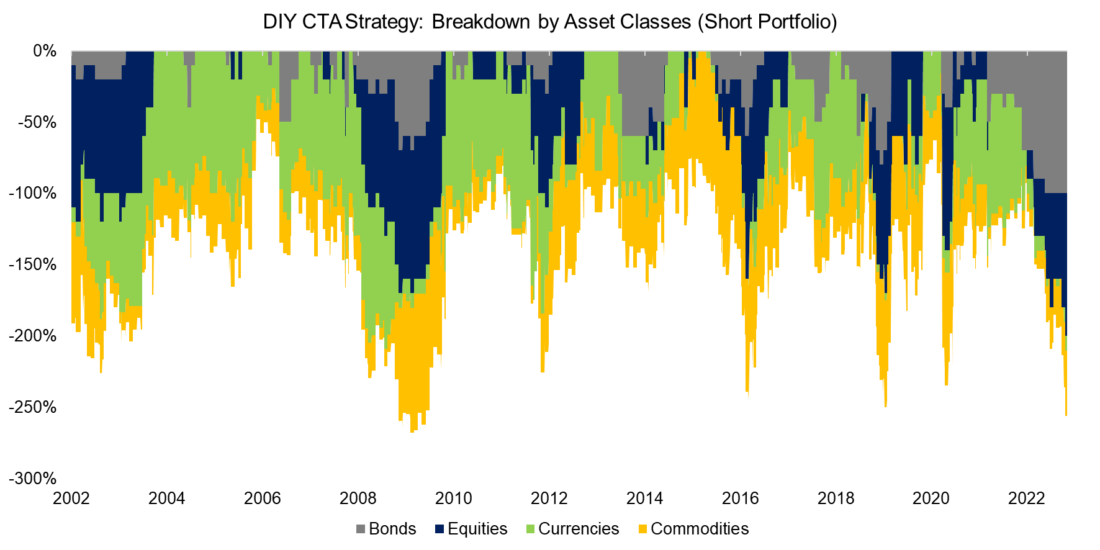
Source: Finominal
The next exposure, i.e. the weights of the long portfolio minus the weights of the short portfolio, of the DIY CTA Strategy highlights the extremity of the year 2022. Negative net exposure on portfolio level primarily occurred during crisis periods, eg the global financial crisis in 2008, but a new record was established in this year. Essentially, the DIY CTA Strategy was short almost everything.
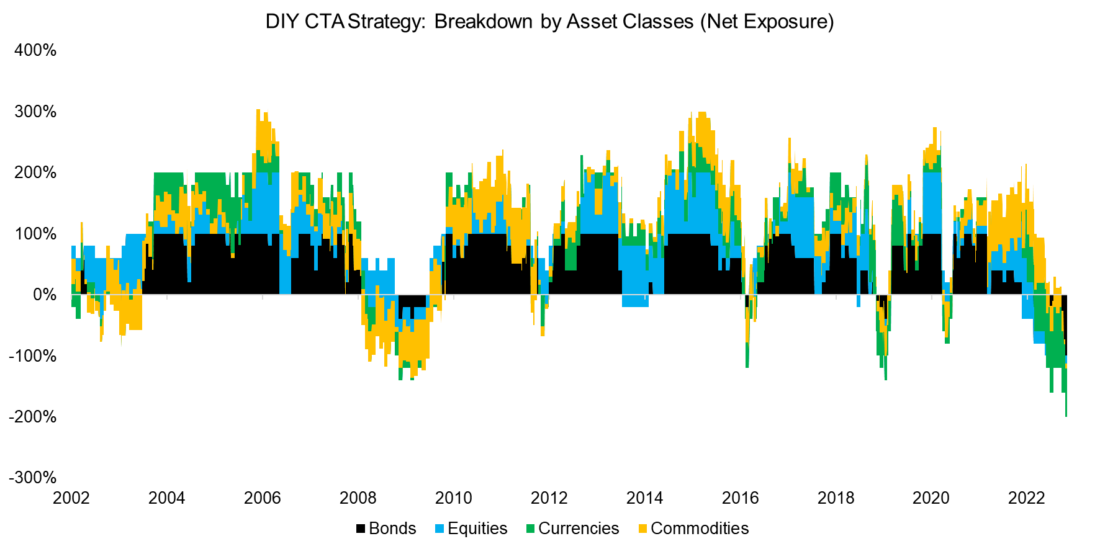
Source: Finominal
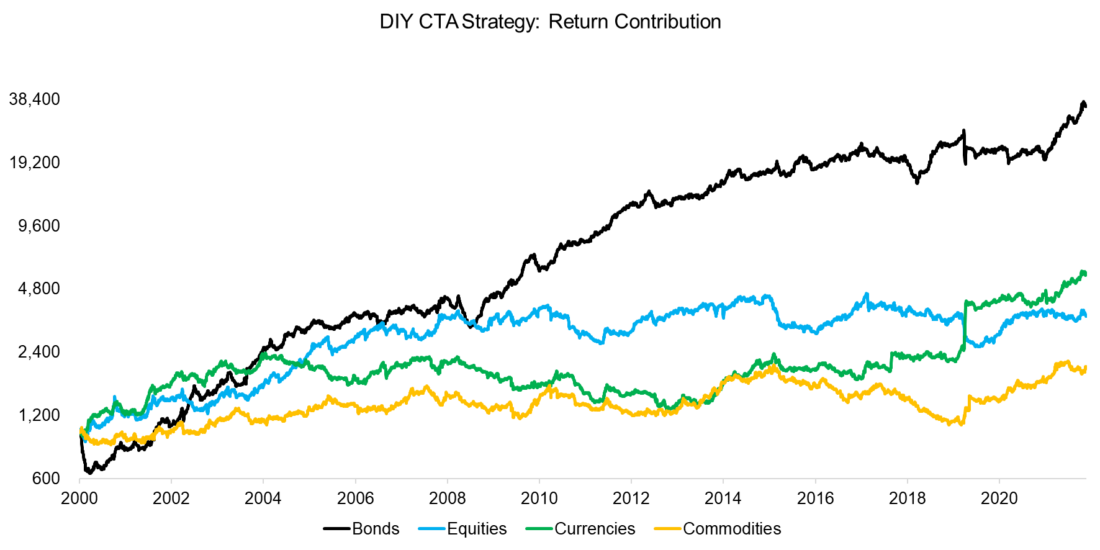
RETURN CONTRIBUTION ANALYSIS
Finally, we review how the four asset classes have contributed to the performance of the DIY CTA Strategy. Applying the simple trend following strategy has generated positive returns in all asset classes, which is post transaction costs of 0.10% per trade.
However, most returns can be contributed to bonds (try Finominal’s Portfolio Diagnostics for a contribution analysis), which generated a CAGR of 17.7%, compared to 8.3% for currencies, 6.0% for equities, and 3.2% for commodities.
A cynical investor might argue that CTAs were a levered bet on bonds, similar to the criticism of risk parity strategies, but the argument does not hold true as CTAs made money off bonds in 2022, simply by shorting them.
Source: Finominal
FURTHER THOUGHTS
The beauty of managed futures strategies is that there is always a trend somewhere that can be exploited. It does not matter if that market is going up or down.
Given this, CTAs are largely uncorrelated to all other asset classes and therefore excellent for diversification. Naturally subject to the caveat that no strategy works all the time, and there have been, as well as will be, years of low to negative returns.
However, it is interesting to explore in which markets trend following works best and worst. Intuitively, up and down trends should be equally distributed and returns not skewed negatively as that makes catching trends more challenging. Equities and bonds might not be so attractive from this perspective given long bull and short bear markets. In contrast, commodities and currencies are less skewed. Perhaps best to befriend only certain trends.
Disclosure: Interactive Brokers
Information posted on IBKR Campus that is provided by third-parties does NOT constitute a recommendation that you should contract for the services of that third party. Third-party participants who contribute to IBKR Campus are independent of Interactive Brokers and Interactive Brokers does not make any representations or warranties concerning the services offered, their past or future performance, or the accuracy of the information provided by the third party. Past performance is no guarantee of future results.
This material is from Finominal and is being posted with its permission. The views expressed in this material are solely those of the author and/or Finominal and Interactive Brokers is not endorsing or recommending any investment or trading discussed in the material. This material is not and should not be construed as an offer to buy or sell any security. It should not be construed as research or investment advice or a recommendation to buy, sell or hold any security or commodity. This material does not and is not intended to take into account the particular financial conditions, investment objectives or requirements of individual customers. Before acting on this material, you should consider whether it is suitable for your particular circumstances and, as necessary, seek professional advice.