


This research article was originally posted at Finominal.
It’s all a matter of perspective
January 2023 Reading Time: 10 Minutes. Author: Nicolas Rabener.
This research note was originally published by the CFA Institute’s EI blog.
SUMMARY
- Using monthly versus daily returns when calculating correlations can change the perspective
- Foreign stock markets and US bond markets were highly correlated to US stocks using monthly returns
- Diversification benefits may have been significantly overstated using daily returns
INTRODUCTION
Investing can seem like an endless cycle of booms and busts. The markets and instruments may change — tulips in 1634, tech stocks in 2000, cryptocurrencies in 2021 — but the speculator’s drive to make fast money remains constant.
Yet once investors have lived through a bubble or two, we tend to become more conservative and cautious. The ups and downs, the peaks and crashes, combined with the trial-and-error process, help lay the foundation for our core investment strategy, even if it’s just the traditional 60-40 portfolio.
With memories of past losses, battle-worn investors are skeptical about new investing trends. But sometimes we shouldn’t be.
Once in a while, new information comes along that turns conventional wisdom on its head and requires us to revise our established investing framework. For example, most investors assume that higher risk is rewarded by higher returns. But ample academic research on the low volatility factor indicates that the opposite is true. Low-risk stocks outperform high-risk ones, at least on a risk-adjusted basis (read The Dark Side of Low Volatility Stocks).
Similarly, the correlations between long-short factors — like momentum and the S&P 500 in 2022 — dramatically change depending on whether they are calculated with monthly or daily return data (read Beta in Beta-Neutral Factors). Does this mean we need to reevaluate all the investing research based on daily returns and test that the findings still hold true with monthly returns?
To answer this question, we analyzed the S&P 500’s correlations with other markets on both a daily and monthly return basis.
CORRELATIONS USING DAILY RETURNS
First, we calculated the rolling three-year correlations between the S&P 500 and three foreign stock and three US bond markets based on daily returns. The correlations among European, Japanese, and emerging market equities as well as US high-yield bonds increased consistently since 1989. Why? The globalization process of the last 30 years no doubt played a role as the world economy grew more integrated.
In contrast, US Treasury and corporate bond correlations with the S&P 500 varied across time: They were modestly positive between 1989 and 2000 but went negative thereafter. This trend, combined with positive returns from declining yields, made bonds great diversifiers for equity portfolios over the last two decades.
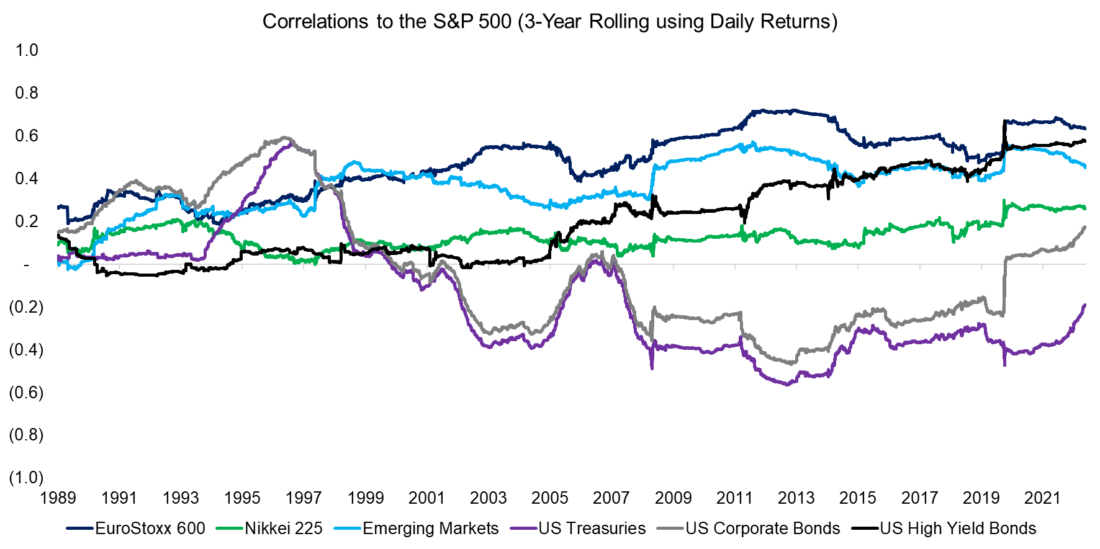
Source: Finominal
CORRELATIONS USING MONTHLY RETURNS
What happens when the correlations are calculated with monthly rather than daily return data? Their range widens. By a lot.
Japanese equities diverged from their US peers in the 1990s following the collapse of the Japanese stock and real estate bubbles. Emerging market stocks were less popular with US investors during the tech bubble in 2000, while US Treasuries and corporate bonds performed well when tech stocks turned bearish thereafter. In contrast, US corporate bonds did worse than US Treasuries during the global financial crisis (GFC) in 2008, when T-bills were one of the few safe havens.
Overall, the monthly return chart seems to more accurately reflect the history of global financial markets since 1989 than its daily return counterpart.
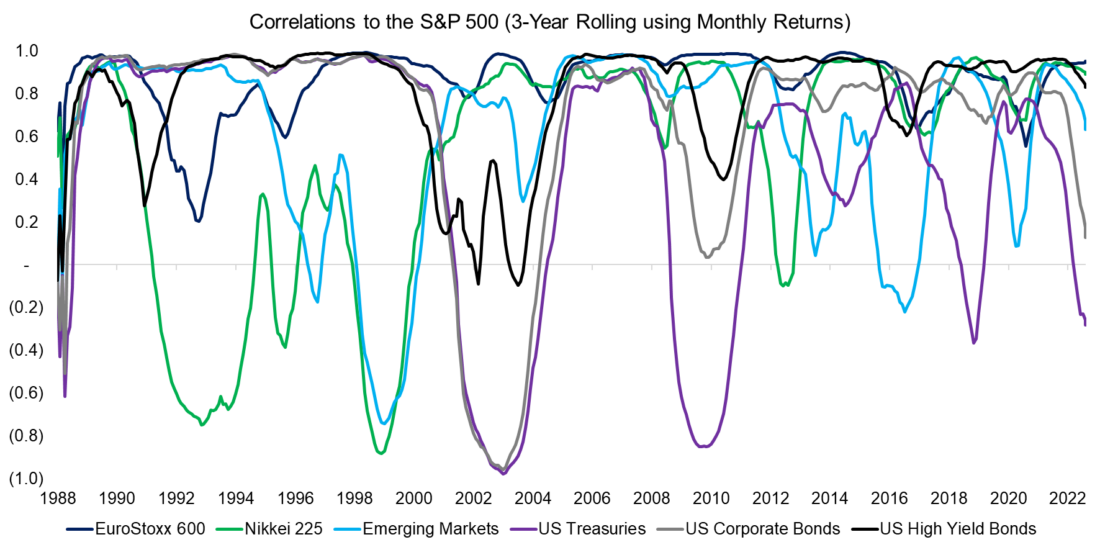
Source: Finominal
DAILY VERSUS MONTHLY RETURNS
According to monthly return data, the average S&P 500 correlations to the six stock and bond markets grew over the 1989 to 2022 period.
Now, diversification is the primary objective of allocations to international stocks or to certain types of bonds. But the related benefits are hard to achieve when average S&P 500 correlations are over 0.8 for both European equities and US high-yield bonds (read 60/40 portfolios Without Bonds).
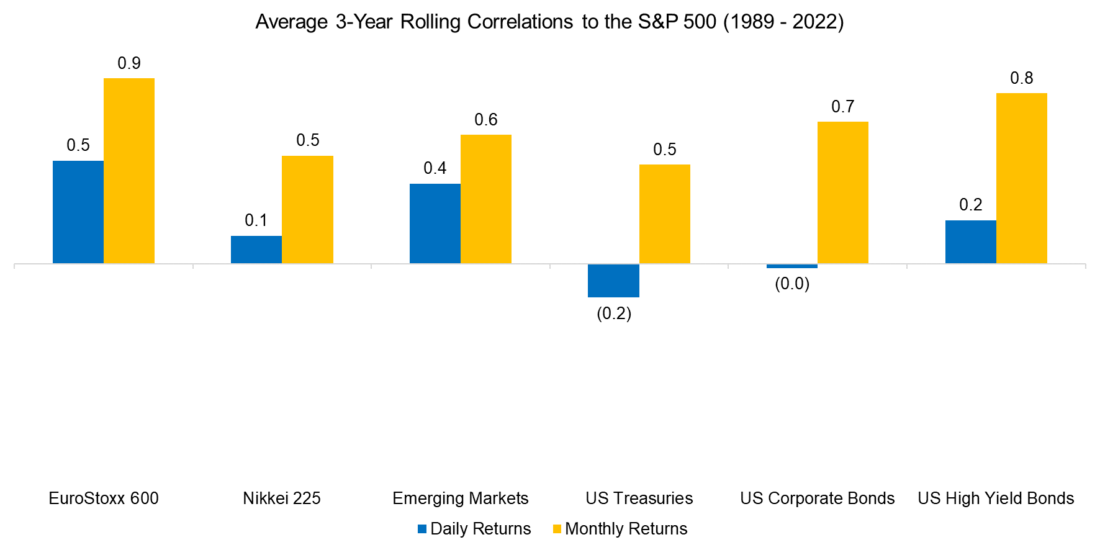
Source: Finominal
Finally, by calculating the minimum and maximum correlations over the last 30 years with monthly returns, we find all six foreign stock and bond markets almost perfectly correlated to the S&P 500 at certain points and therefore would have provided the same risk exposure (try Finominal’s Portfolio Diagnostics to analyze your risk exposures).
But might such extreme correlations have only occurred during the few serious stock market crashes? The answer is no. US high yields had an average correlation of 0.8 to the S&P 500 since 1989. But except for the 2002 to 2004 era, when it was near zero, the correlation actually was closer to 1 for the rest of the sample period.
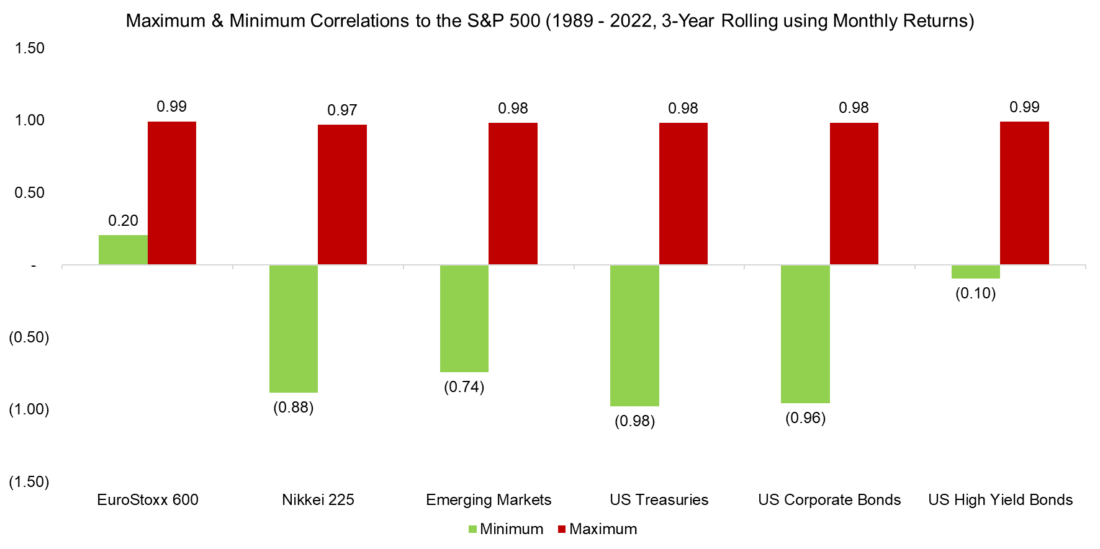
Source: Finominal
FURTHER THOUGHTS
Financial research seeks to build true and accurate knowledge about how financial markets work. But this analysis shows that changing something as simple as the lookback frequency yields vastly conflicting perspectives. An allocation to US high-yield bonds can diversify a US equities portfolio based on daily return correlations. But monthly return data shows a much higher average correlation. So, what correlation should we trust, daily or monthly?
This question may not have one correct answer. Daily data is noisy while monthly data has far fewer data points and is thus statistically less relevant.
Given the complexity of financial markets as well as the asset management industry’s marketing efforts, which frequently trumpet equity beta in disguise as “uncorrelated returns (read Myth Busting: Alts’ Uncorrelated Returns Diversify Portfolios),” investors should maintain our perennial skepticism. That means we’re probably best sticking with whatever data advises the most caution.
After all, it’s better to be safe than sorry.
Disclosure: Interactive Brokers
Information posted on IBKR Campus that is provided by third-parties does NOT constitute a recommendation that you should contract for the services of that third party. Third-party participants who contribute to IBKR Campus are independent of Interactive Brokers and Interactive Brokers does not make any representations or warranties concerning the services offered, their past or future performance, or the accuracy of the information provided by the third party. Past performance is no guarantee of future results.
This material is from Finominal and is being posted with its permission. The views expressed in this material are solely those of the author and/or Finominal and Interactive Brokers is not endorsing or recommending any investment or trading discussed in the material. This material is not and should not be construed as an offer to buy or sell any security. It should not be construed as research or investment advice or a recommendation to buy, sell or hold any security or commodity. This material does not and is not intended to take into account the particular financial conditions, investment objectives or requirements of individual customers. Before acting on this material, you should consider whether it is suitable for your particular circumstances and, as necessary, seek professional advice.