


Traditionally, analysis of corporate earnings reports such as 10K and 10Q has been a task for the fundamental researcher. Hedge fund managers, research analysts and finance experts would normally wait impatiently for corporate filings and eagerly read through such reports in order to answer two fundamental questions:
- Did the company meet or exceed expectations?
- What is the new trajectory for the company into its next quarterly or annual earnings?
Astute investors know that fundamental research, along with the expertise and time needed to do it right, is essential for stock forecasting.
With advancement in NLP and machine learning science, one could only assume how transformational automatically parsing and analyzing corporate filings would be. Greater accuracy, wider corporate coverage, faster time-to-market, and lower cost are just some of the benefits.
Therefore, it’s not surprising to learn that many have invested significantly in R&D to crack the footnotes code. The main challenges in automating analysis of corporate earnings reports are the complexities of many disclosures and the lack of standard reporting format, particularly for one-off, transitory gains/losses hidden in footnotes of reported and consensus earnings.
Recently, we’ve partnered with New Constructs (NC), an 18-year veteran in independent research.
Our research focused on validating the predictive nature of NC data by comparing consensus earnings to the “true” Core Earnings. Our goal was to identify the stocks where the street gets earnings most wrong.
Our Hypothesis: A buy long signal is triggered when a company’s true earnings (Core Earnings) is understated compared to consensus, i.e., Earnings Distortion is negative. When such an understatement is not understood by the market, the street under-estimates future earnings, and thus provides an opportunity for a buy long entry. Conversely, a sell short signal is triggered when a company’s true earnings (Core Earnings) is overstated compared to consensus, i.e., Earnings Distortion is positive. When such an overstatement is not understood by the market, it provides opportunity for a sell short entry.
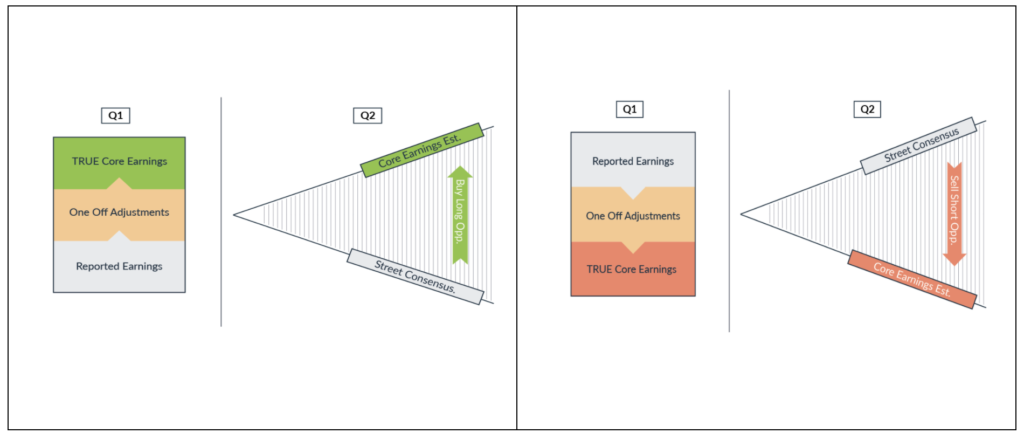
Images 1 & 2: Reported earnings is understated presents a buying opportunity and conversely when reported earnings is overstated it presents a selling opportunity.
Source: Neuravest Research Platform DAS (Data Analytics Suite)
The Research:
Step 1 – Validating the Raw Data
Our research focused first on validating New Constructs’ data by identifying companies that respond similarly to earnings distortions. The graph below demonstrates clustering, an unsupervised machine learning technique, geared to group stocks by how similarly their stock price responds to certain Earnings Distortions. In contrast to grouping assets by predetermined GICS code (Global Industry Classification Standard) or industry sectors, we let the data determine how to group assets based on certain similarities, specifically, how they respond to market changes (such as in volatility or new earnings distortion).
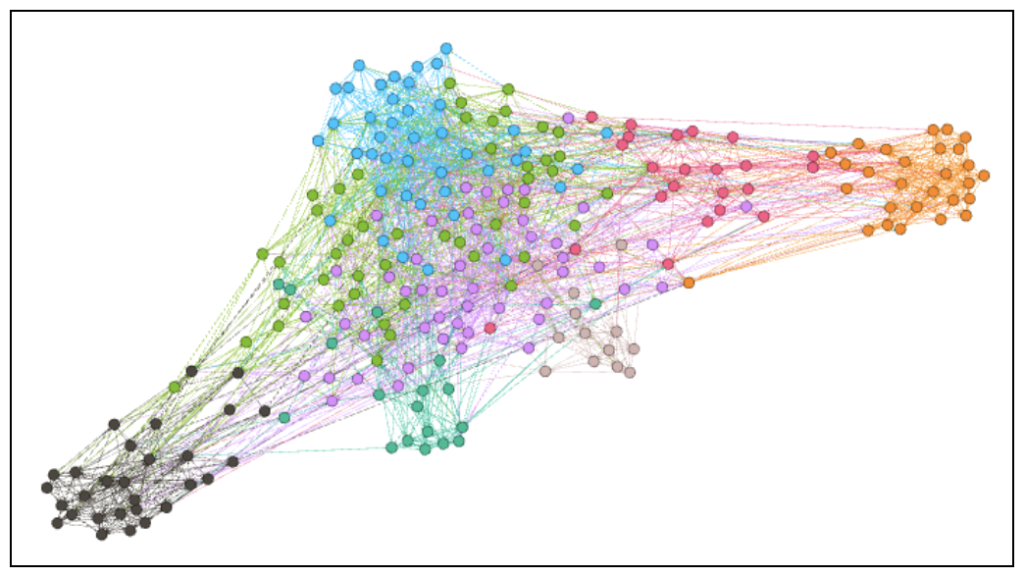
Image 3: Clustering used to group similarly behaving stocks post-earnings having similar Earnings Distortions. A spring-force graph is used to demonstrates elements that attract based on similarities and repel based on dissimilarities.
Source: Neuravest Research Platform DAS (Data Analytics Suite)
Step 2 – Assessing Alpha Decay
Since earnings are released just once per quarter, we looked to evaluate how long past earnings release dates it takes for stock prices to adjust to Earnings Distortion (also called measuring alpha decay). In other words, we looked to assess how long on average it takes for the market to adjust a stock’s price displacement due to Earnings Distortions.
We first looked at long investment opportunities resulting from negative Earnings Distortions. We divided all assets in the Russell 1,000 into deciles (or 10 bins) each representing Earnings Distortion as a percentage of GAAP earnings.
Bin 1: Decile with the most negative distortions.
Bin 10: Decile with least negative or positive distortions.
The image below showcases how larger distortions affects the price of stocks more meaningfully and for a longer time frame (longer alpha decay, compared to lower distortions.
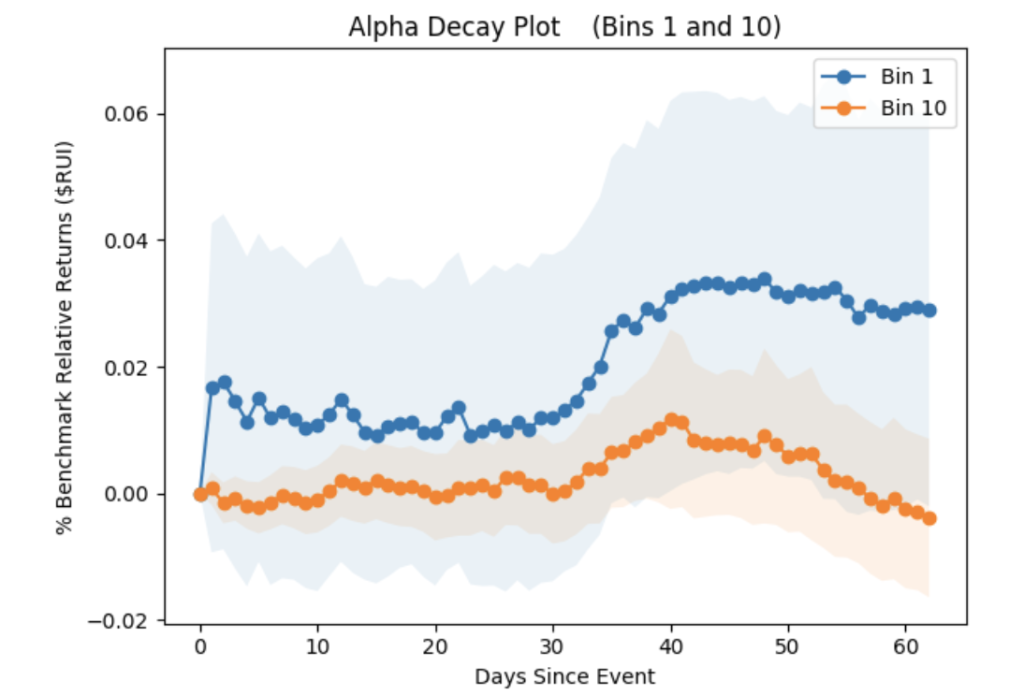
Image 4: Comparing lowest decile in orange to highest decile in blue provides clear evidence that the higher the distortion the more pronounced the subsequent price action.
Source: Neuravest Research Platform DAS (Data Analytics Suite)
Given the strong evidence of predictive information in New Constructs’ data, we moved swiftly into machine learning models in order to conduct backtests on whether earnings distortions, as a feature, can be fed into a machine learning classifier. (A classifier is a machine learning objective which targets a predetermined state.) In our case, we looked for one of three states: buy, sell, or do nothing. Our goal was to identify when to buy a stock, how long to hold it, and when to ultimately sell it in order to maximize the likelihood of profit.
Step 3: Portfolio Construction:
This is the phase in which we apply the heaviest machine learning research. It involves model training, hyper-parameter tuning, cross validation, back testing, perpetual roll-forward testing, and quite a few additional AI disciplines.
Our model’s objectives were to forecast a company’s future core earnings and compare it to the street’s projected earnings. In addition, since we are looking to compare companies of various sizes, we needed to normalize earnings distortion to a company’s size. We chose to use market cap for this particular task.
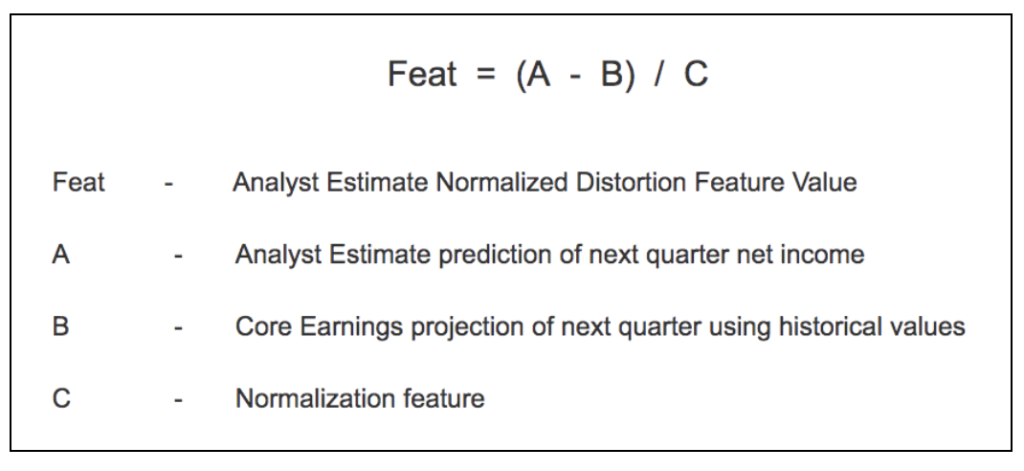
Image 5: Normalizing distortion values as percent of the underlying company’s market cap.
Source: Neuravest Research Platform DAS (Data Analytics Suite)
In summary, our goal was to take New Constructs’ raw data and form machine learning models that will forecast a company’s true future earnings (after adjusting for one-off, non-recurring distortions), compare such future earnings to the street’s estimated earnings and, when a meaningful variance is identified, act by either buying or selling the underlying stock.
The chart below demonstrates our process in taking New Constructs’ data and conditioning it for a model portfolio investment as follows:
● Breaking the constituent universe (Russell 1K) into quintiles by market cap.
● Applying clustering to further hone in on similarly behaving stocks to earnings distortions.
● Feeding earning distortions factors into machine learning classifiers.
● Generating buy/sell/do-nothing signals.
● Constructing the portfolio by identifying:
- Our target stocks.
- Allocations, volatility constraints.
- Exit criteria – stop loss, target gain, holding time horizon.
- Capacity constraints and position sizing.
- And much more…
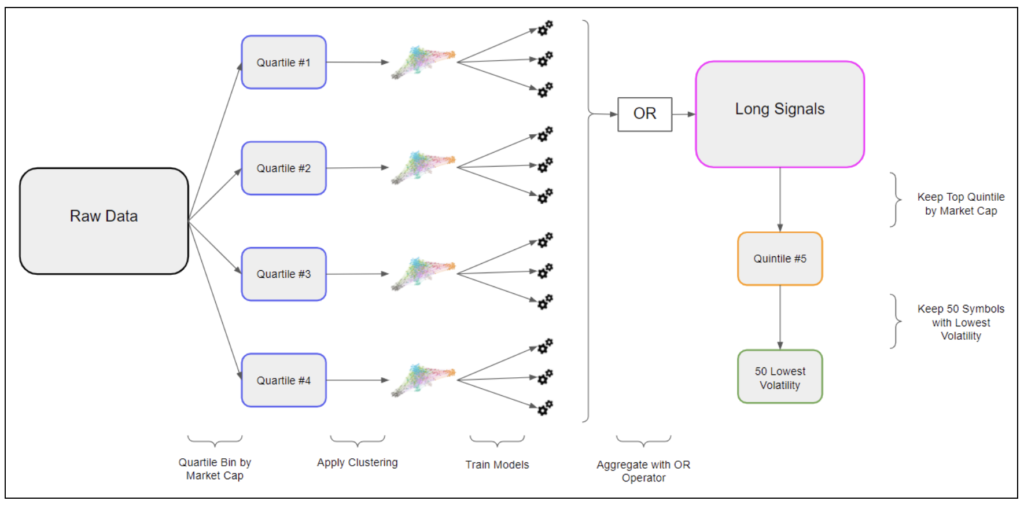
Image 6: Demonstrating the life cycle of utilizing New Constructs’ data to form market cap quintiles, on which we apply clustering to fairly comparable constituents’ distortions. Subsequently, we train an ensemble of models to vote a “buy,” “sell,” or “do nothing” classification.
Source: Neuravest Research Platform DAS (Data Analytics Suite)
The Results
The results below are of a backtest simulation on Lucena’s DAS (Data Analytics Services) platform. We were able to empirically validate how actionable New Constructs data is for both long and short investment scenarios. To further validate our models and ensure no look-forward bias, we are now perpetually paper trading the models into the future.
Backtest – New Constructs Long Only – View Backtest
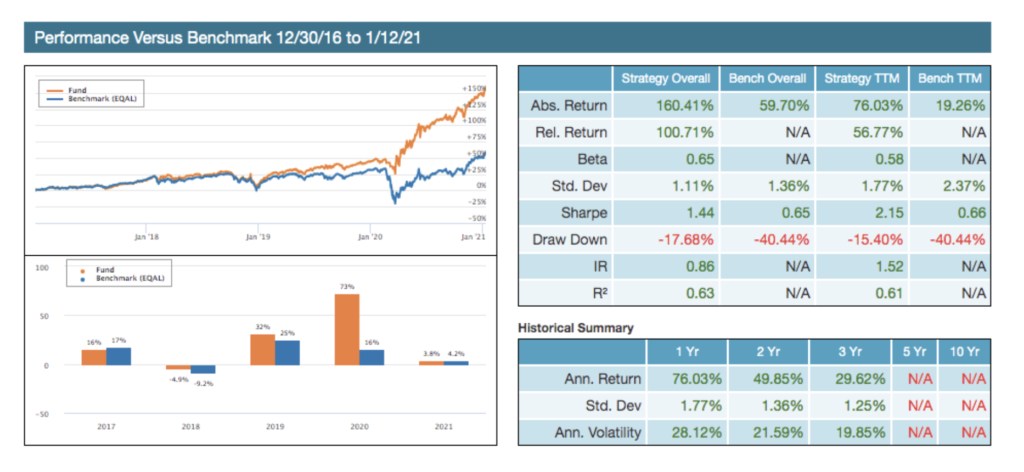
Image 7: New Constructs Long Only Earnings Distortion Portfolio.
Source: Neuravest Research Platform DAS (Data Analytics Suite)
The backtest screens the Russell 1000 daily for the stocks with the most meaningful variance between the street’s and our model’s core earnings estimate. The portfolio’s goal is to outperform the Russell 1000 equally weighted benchmark in risk adjusted return as measured by its Sharpe ratio. In addition, we conducted a backtest to identify short signals based on an overstated street outlook as compared to a company’s true earnings outlook (core earnings).
Backtest – New Constructs Short Only – View Backtest
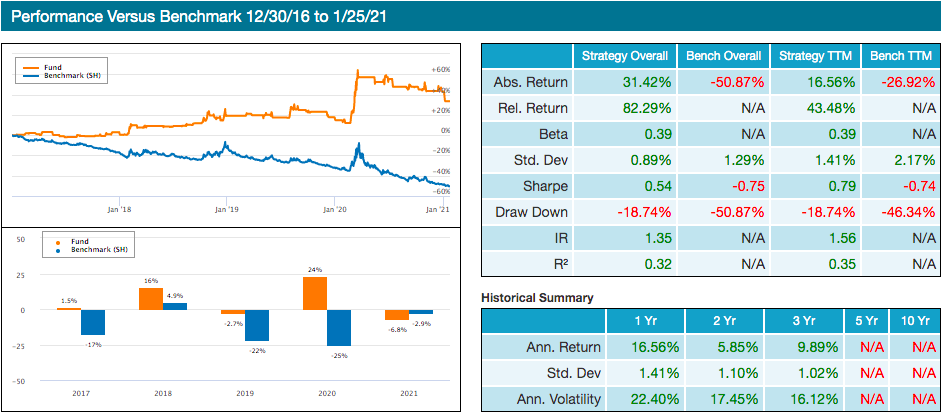
Image 8: New Constructs Short Only Earnings Distortion Portfolio
Source: Neuravest Research Platform DAS (Data Analytics Suite)
The backtest screens the Russell 1000 daily for the stocks with the highest earnings distortions. The portfolio’s goal is to outperform SH (inverse S&P 500 ETF) in risk- adjusted return as measured by its Sharpe ratio.
Conclusion
Data is the fuel that feeds the AI engine. When a proprietary data source such as New Constructs presents insights into a company’s true Core Earnings before the street realizes it, investment opportunities arise.
Next week, I will be covering another exciting set of strategies that are based on social media sentiment, and specifically, crowd voting sentiment. We will learn about leveraging cutting-edge machine learning technology to identify superusers and score confidence at the aggregate towards specific investable assets. For reference see Pynk.io
If you are a data provider with unique data that could be useful for investment, we want to talk to you. In addition, if you are an investment professional looking for winning investment portfolios, feel free to reach out to us. We’re happy to grant you trial access to a model portfolio that suits your investment style and mandate.
Have a great week!
Erez M. Katz.
#nlp #modelportfolio #algorithmictrading #newssentiment #bigdatasolutions #aiinvestment #statisticalmodeling #stockmarketanalysis
Visit Neuravest to find additional insight on this topic: https://neuravest.net/finding-treasure-in-corporate-earnings-reports/.
Disclosure: Interactive Brokers
Information posted on IBKR Campus that is provided by third-parties does NOT constitute a recommendation that you should contract for the services of that third party. Third-party participants who contribute to IBKR Campus are independent of Interactive Brokers and Interactive Brokers does not make any representations or warranties concerning the services offered, their past or future performance, or the accuracy of the information provided by the third party. Past performance is no guarantee of future results.
This material is from Neuravest Research Inc. and is being posted with its permission. The views expressed in this material are solely those of the author and/or Neuravest Research Inc. and Interactive Brokers is not endorsing or recommending any investment or trading discussed in the material. This material is not and should not be construed as an offer to buy or sell any security. It should not be construed as research or investment advice or a recommendation to buy, sell or hold any security or commodity. This material does not and is not intended to take into account the particular financial conditions, investment objectives or requirements of individual customers. Before acting on this material, you should consider whether it is suitable for your particular circumstances and, as necessary, seek professional advice.