


In my last post, we discussed how to create and read Word files with R’s officer package. This article will expand on officer by showing how we can use it to create PowerPoint reports.
Getting started
Let’s get started by loading officer.
library(officer)Next, we’ll create a PowerPoint object in R using the read_pptx function.
pres <- read_pptx()To add a slide, we use the add_slide function. The first slide we’ll create is the title slide. We specify the type of slide in the layout parameter. There’s several other possibilities here including “Title and Content”, “Blank”, “Title Only”, “Comparison”, “Two Content”, and “Section Header”.
Secondly, we use ph_with to add the title text.
# add title slide
pres <- add_slide(pres, layout = "Title Only", master = "Office Theme")

# add Title text
pres <- ph_with(pres, value = "My first presentation", location = ph_location_type(type = "title"))
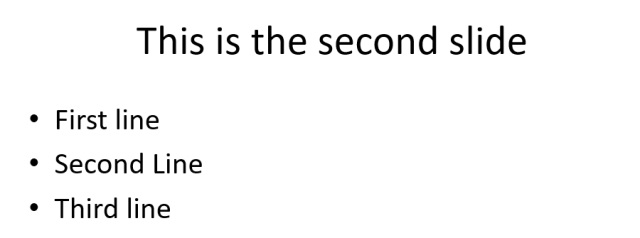
Next, let’s add another slide. This time we’ll have a title and content.
pres <- add_slide(pres, layout = "Title and Content", master = "Office Theme")
pres <- ph_with(pres, value = "This is the second slide", location = ph_location_type(type = "title"))
pres <- ph_with(pres, value = c("First line", "Second Line", "Third line"), location = ph_location_type(type = "body"))
How to add tables
Now, what if we want to add a table? Let’s create a sample data frame and add it to a new slide. Again, we’ll use ph_with to add the content (data frame in this case) to the new slide. This time we just need to set the value parameter equal to our data frame object.
# create sample data frame
frame <- data.frame(a = 1:10, b = 11:20, c = 21:30)

# create slide to hold table
pres <- add_slide(pres, layout = "Title and Content", master = "Office Theme")
pres <- ph_with(pres, value = "Table Example", location = ph_location_type(type = "title"))

# add data frame to PowerPoint slide
pres <- ph_with(pres, value = frame, location = ph_location_type(type = "body"))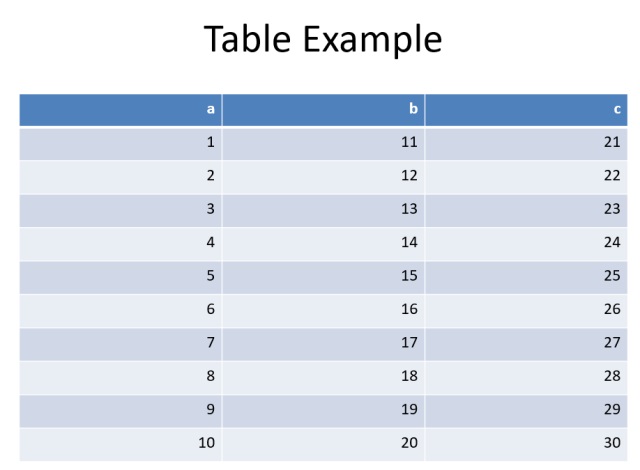
Adding plots and images
Plots and images can also be added to the PowerPoint document. In the code below we add a ggplot object to a new slide.
library(ggplot2)
pres <- add_slide(pres, layout = "Blank", master = "Office Theme")
sample_plot <- ggplot(data = frame) + geom_point(mapping = aes(1:10, a),
                                      size = 3) + theme_minimal()

pres <- ph_with(pres, value = sample_plot, location = ph_location_fullsize())
External images can be loaded like this:
pres <- add_slide(pres)
pres <- ph_with(pres, external_img("sample_image.png", width = 2, height = 3),
               location = ph_location_type(type = "body"), use_loc_size = FALSE )
Note how in this case, we wrap the name of the image file along with the width and height sizes we want inside the external_img function.
Adjusting font and colors
Font sizes and colors can be adjusted using the fp_text function. In the example below we created two paragraphs – the first one is bold, while the second one is green.
library(magrittr)

# create bold text object with size 24 font
bold <- fp_text(font.size = 24, bold = TRUE)

# create green Arial text object with size 24 font
green <- fp_text(font.size = 24, color = "green", font.family = "Arial")

# create block list of two paragraphs with the above font specifics
pars <- block_list(fpar(ftext("This line is bold", bold)), fpar(ftext("This line is green and Arial", green)))

# add slide with paragraphs
pres <- add_slide(pres, layout = "Title and Content", master = "Office Theme") %>% ph_with(pars, location = ph_location_type(type = "body"))

Adding hyperlinks
Lastly, we can add hyperlinks to our presentation using the ph_hyperlink function. Below, we create a hyperlink with the text “Click Here” that points to https://theautomatic.net.
pres <- add_slide(pres)

pres <- ph_with(pres, "Click Here", location = ph_location_type(type = "body"))
pres <- ph_hyperlink(pres, href = "https://theautomatic.net")
Conclusion
That’s all for now! If you liked this post, please follow my blog on Twitter or subscribe to my new YouTube channel.
Visit TheAutomatic.net for additional insight on this topic.
Disclosure: Interactive Brokers
Information posted on IBKR Campus that is provided by third-parties does NOT constitute a recommendation that you should contract for the services of that third party. Third-party participants who contribute to IBKR Campus are independent of Interactive Brokers and Interactive Brokers does not make any representations or warranties concerning the services offered, their past or future performance, or the accuracy of the information provided by the third party. Past performance is no guarantee of future results.
This material is from TheAutomatic.net and is being posted with its permission. The views expressed in this material are solely those of the author and/or TheAutomatic.net and Interactive Brokers is not endorsing or recommending any investment or trading discussed in the material. This material is not and should not be construed as an offer to buy or sell any security. It should not be construed as research or investment advice or a recommendation to buy, sell or hold any security or commodity. This material does not and is not intended to take into account the particular financial conditions, investment objectives or requirements of individual customers. Before acting on this material, you should consider whether it is suitable for your particular circumstances and, as necessary, seek professional advice.