


The topic of Smart-Beta is widely recognized, and we cover, monitor, and inform about its developments. The analyzed piece is about the importance of the correct rebalancing strategy and is kindly provided by Research Affiliates. For other posts related to rebalancing strategies, you may check posts #1, #2, or #3.
Arnott, Li, and Linnainmaa (March 2023) arrive at interesting and novel insights about what factors influence your overall portfolio performance pertaining to rebalancing frequency and the choice of what you exactly rebalance or omit to rebalance in your portfolio. There is a kind of linear relationship: The more we trade, the more our portfolio pays in transaction costs. PMs (portfolio managers) can surely agree. It is useful to set some constraints, and formulate mathematic optimization problem to find equilibrium (sweet spot) in which advantages (pros) outweights disadvantages (cons), simply to be cost effective.
Paper rightly points out that you must not only consider number of time you run your rebalacing endeveous, but also account into the stocks liquidity. If there is insufficient, like in case of small-caps or low floaters, you might get very wide spreads if you rebalance hurrily (e. g. when everybody else do) and do not take your time to batch out the rebalancing acts. Authors attributions is holistic transaction cost model which outputs different signals which have different speeds of decay. We would like to put the main point and stress it out: “priority-best rule is better for controlling turnover in a non-calendar-based rebalancing setting than in (classical) calendar-based setting. Its good performance in controlling turnover relative to the two alternatives—priority-worst and proportional rebalancing rules—comes as no surprise when we recognize that the priority-best rule, by virtue of prioritizing trades in stocks that are the farthest removed from the portfolio selection threshold, is likely to minimize the expected need for additional trading. Moreover, if expected returns are approximately monotonic in signals, this rule also has the benefit of spending the turnover on stocks that make the greatest difference in terms of expected return.”
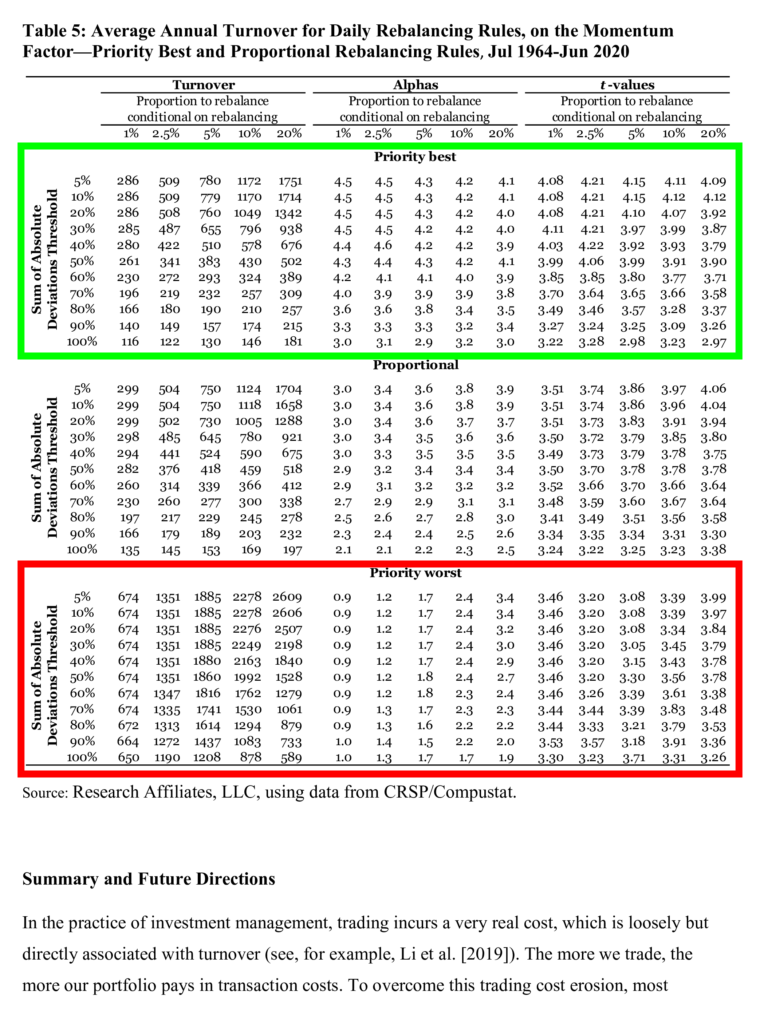
So, according to the themes in the research article investors should re-consider to rebalance with turnover constraint only those stocks that have the strongest signal. As with calendar-based rebalancing, the priority-best rule typically outperforms the other two rules as a method for managing turnover while retaining high alpha. In Table 5, nicely highlighted fields show that pertaining to this simple rule increases alpha significantly.
Authors: Robert D. Arnott, Feifei Li, and Juhani T. Linnainmaa
Title: Smart Rebalancing
Link: https://papers.ssrn.com/sol3/papers.cfm?abstract_id=4381611
Abstract:
Implementation shortfall, whether from trading costs, discontinuous trading, or other frictions, erodes the performance of any investment strategy. These frictions, along with asset management fees, are the main sources of the sometimes-vast gap between live results and paper portfolio performance. Smart beta and factor strategies are not exceptions. In this paper, we investigate how smart rebalancing methods can capture most of the factor premia for a long-only paper portfolio, while cutting turnover and trading costs relative to a fully rebalanced portfolio. We demonstrate the efficacy of prioritizing trades to the stocks with the most attractive signals and of focusing portfolio turnover on the trades that offer the highest potential performance impact.
And as always, we present several interesting figures and tables:
Notable quotations from the academic research paper:
“[W]e first examine the performance and related turnover of a few popular factor strategies. We then present the results for the same strategies after applying three different turnover reduction methods to the periodic portfolio rebalancing trades. Each begins with a target turnover constraint. The first rebalancing method, which we call the proportional rebalancing, trades all stocks proportionally to meet the turnover target. For example, if the strategy indicates trades that are twice as large as the turnover target, this method trades 50% of the indicated trade for each stock. The second rebalancing method, which we call priority best, buys the stocks with the most attractive signals and sells the stocks with the most unattractive signals, until the turnover target is reached.3
The third method, which we call priority worst, is similar to the priority best method, except that we deliberately sort the queues in the “wrong” order. We buy the stocks that seem least useful (i.e., the most marginal in terms of their signals) and sell those that just barely fall out of the target portfolio, saving the strongest buy or sell signals to trade last.
In these comparisons, we find that the priority best method typically outperforms the other two methods. When it does not outperform, we trace the reason for its failure to a nonmonotonic relationship between the signals and expected returns.
We also test a non-calendar-based rebalancing methodology. Instead of forcing the portfolios to rebalance on a fixed schedule, such as at the end of every month or once a year, we consider a rule in which we rebalance when the distance between the current and target portfolios exceeds a preset threshold. Conditional on meeting this threshold, we then rebalance a prespecified proportion of the deviations using one of the three rules: (a) proportional rebalancing, (b) priority best, or (c) priority worst.
We construct value, profitability, investment, and momentum factors. We use the Fama and French (1993, 2015) definitions for the signals underlying the value, profitability, and investment factors: value sorts stocks into portfolios by their book value-to-market ratios, profitability by their operating profits-to-book value of equity, and investment by the annual growth in total assets. The signal underlying the momentum factor is that of Carhart (1997): a stock’s return from month t − 12 through t – 2 (excluding t – 1).
Our benchmarks, which we call the reference factors, are long-only factors based on these signals. We sort stocks into quartiles using NYSE breakpoints. We create four annually and three monthly rebalanced reference factors. We rebalance the value, profitability, and investment factors annually at the end of June. These factors are long the stocks in the top signal quartile with weights proportional to the end of June market values of equity. We do not trade these annual factors at all from July to the next May: each month, the weights evolve based on the stocks’ returns excluding dividends. We assume that we reinvest any proceeds from dividends or delisting evenly across all the stocks in the portfolios so that the portfolio weights remain unchanged.4
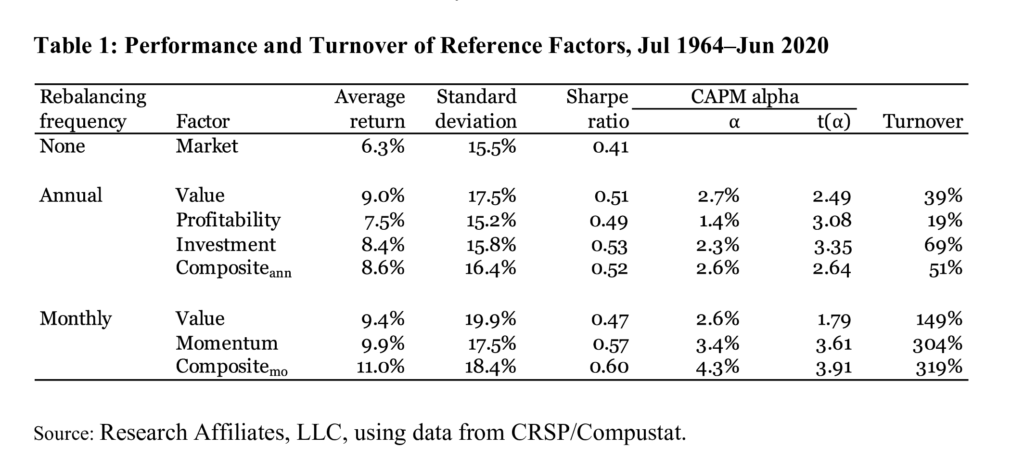
In Table 1 we report average returns, standard deviations, Sharpe ratios, CAPM alphas, and annual turnovers for the seven long-only factors we study. We also report the market portfolio’s average return and Sharpe ratio for reference. The market factor’s Sharpe ratio over the 1964–2020 period is 0.41. The long-only factors, which hold various segments of the market, earn higher Sharpe ratios, ranging from 0.60 for the monthly-rebalanced composite factor to 0.47 for the monthly-rebalanced value factor. All factors, except for the monthly value factor, earn CAPM alphas that are statistically significant at the 5% level.5
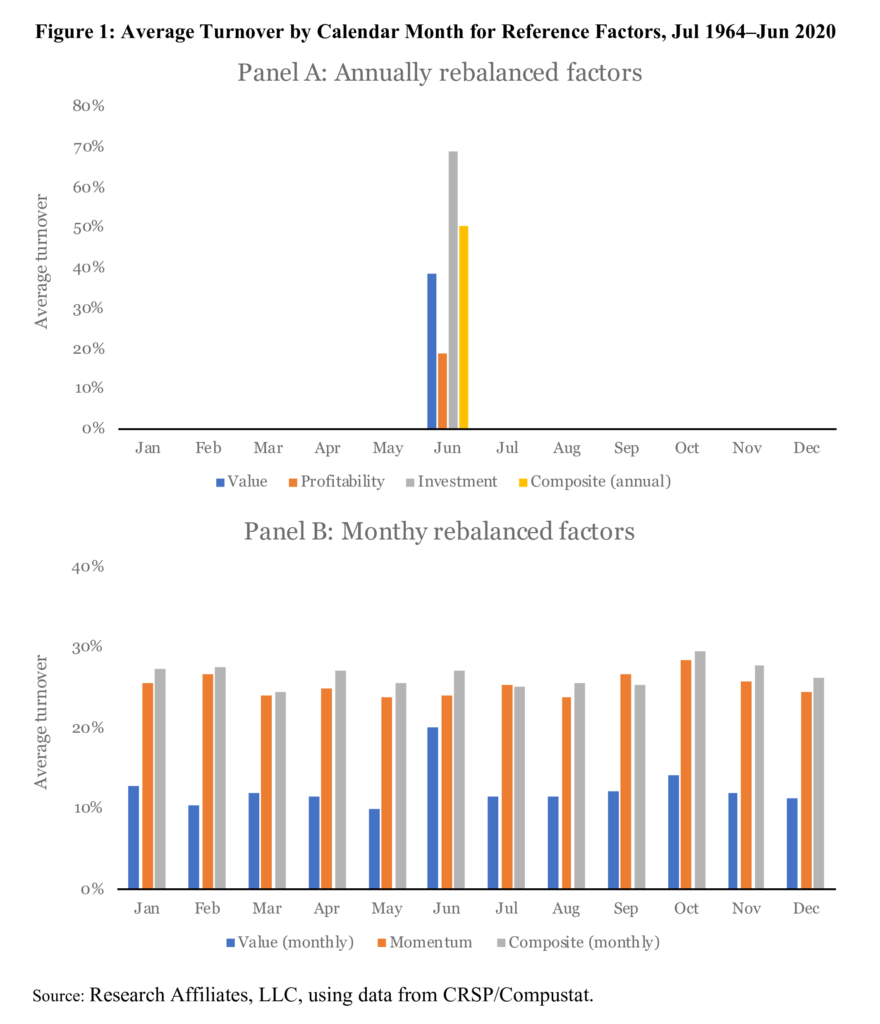
In Table 1 and Figure 1, in which we report average turnover by calendar month, we measure a factor’s turnover as one-half of the absolute sum of differences between the old weights and the new weights. As discussed earlier, we measure active turnover, excluding trades induced by delistings and dividends. The annual factors, by construction, trade only once a year. If we had a factor that each year switched from one set of stocks to another nonoverlapping set of stocks, the factor would incur a maximum one-way turnover of 100%. For monthly factors, by the same logic, the maximum annual turnover is capped at 1200%.
In Table 5, focusing specifically on the daily momentum factor, we report average annual turnover, CAPM alphas, and t-values associated with these alphas for the three rebalancing methods: priority-best, priority-worst, and proportional rules. As with calendar- based rebalancing, the priority-best rule typically outperforms the other two rules as a method for managing turnover while retaining high alpha. This rule retains much of the daily momentum strategy’s alpha, even when the investor cuts turnover quite aggressively. The investor can lower turnover the most by combining a high SAD limit with a small amount to rebalance, conditional on rebalancing. For example, when the SAD limit is 70% and the investor rebalances only 1% of the deviations conditional on hitting this threshold, the investor incurs an average annualized turnover of 196%—which is approximately one-sixteenth of the unconstrained strategy’s turnover—while earning an annualized alpha of 4.0% (t-value = 3.70).”
Originally posted on Quantpedia.
Disclosure: Interactive Brokers
Information posted on IBKR Campus that is provided by third-parties does NOT constitute a recommendation that you should contract for the services of that third party. Third-party participants who contribute to IBKR Campus are independent of Interactive Brokers and Interactive Brokers does not make any representations or warranties concerning the services offered, their past or future performance, or the accuracy of the information provided by the third party. Past performance is no guarantee of future results.
This material is from Quantpedia and is being posted with its permission. The views expressed in this material are solely those of the author and/or Quantpedia and Interactive Brokers is not endorsing or recommending any investment or trading discussed in the material. This material is not and should not be construed as an offer to buy or sell any security. It should not be construed as research or investment advice or a recommendation to buy, sell or hold any security or commodity. This material does not and is not intended to take into account the particular financial conditions, investment objectives or requirements of individual customers. Before acting on this material, you should consider whether it is suitable for your particular circumstances and, as necessary, seek professional advice.
Join The Conversation
If you have a general question, it may already be covered in our FAQs. If you have an account-specific question or concern, please reach out to Client Services.