


Asset prices are driven by factors of different timescales, ranging from long-term market regimes to short-term fluctuations, and they often exhibit nonstationary behaviors, such as time-varying volatility and trends.
The empirical mode decomposition (EMD) is designed for analyzing nonstationary time series. This adaptive data-driven method decomposes any time series into oscillating components with nonstationary amplitudes and frequencies. For an introduction to this approach, we refer to this companion article, Multiscale Analysis for Financial Time Series, on IBKR QuantBlog.
Sector ETFs
Here, we focus our study on the multiscale analysis of sector ETF price dynamics.
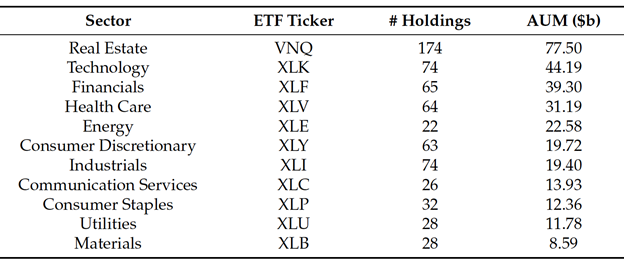
U.S. sector ETFs ranked by asset under management (AUM). Source: Vanguard and State Street Global Advisors as of June 30, 2021.
There are 11 funds representing all the sectors in the U.S. market. Each ETF represents a portfolio of equities within the corresponding sector. The ETFs hold different numbers of stocks, and their assets under management (AUM) range from under U.S.$10 bil to over U.S.$70 bil.
Complementary Ensemble Method
For financial time series with high levels of intrinsic noise, we apply the complementary ensemble empirical mode decomposition (CEEMD). Like EMD, CEEMD decomposes any time series — stationary or not — into a number of intrinsic mode functions (IMFs) at different timescales, but it extracts each component from an ensemble mean computed based on N trials. Moreover, the timescale separation is improved by resolving mode mixing and is thus more robust to intrinsic noise in the data.
We then apply Hilbert spectral analysis to define and compute the associated instantaneous energy-frequency spectrum to illustrate the properties of various timescales embedded in the original time series. In particular, we derive and compute the central frequency associated with a collection of sector ETFs, which allows us to compare the distinct behaviors of ETF prices.
Moreover, our approach is a fully data-driven method and flexible to adapt to the different timescales embedded in the time series. Through the new metrics like filtered conditional volatility and the Hilbert power spectrum, we provide new ways to discern differences among sector ETFs that are hidden in certain timescales. For example, we introduce frequency deviation in order to measure the synchronization between a sector ETF and the market index.
Among our results, we find that sector ETFs exhibit different degrees of volatility asymmetry. Perhaps surprisingly, some sector ETFs, such as XLP, XLY, and XLC, tend to have higher volatility in an upside market than that in a downside market.
Time Series Decomposition
We now illustrate the decompositions of the sector ETFs time series.
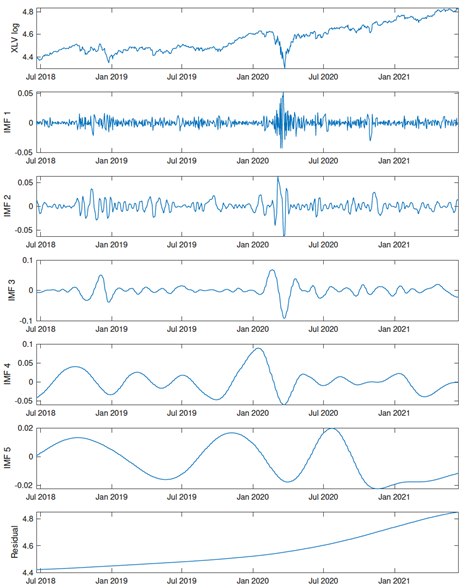
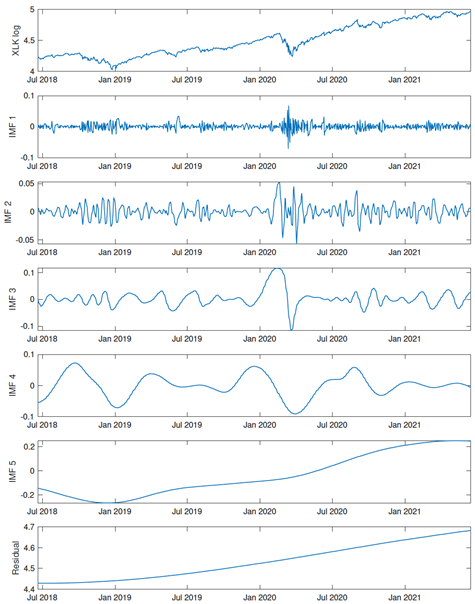
Five IMFs and residual terms were extracted from the time series of XLV and XLK using CEEMD from 6/20/2018–6/15/2021. The top row in each plot shows the original time series (in log prices). The subsequent rows show the IMFs of the corresponding time series, except for the bottom row which shows the residual (the long-term trend). Source: Leung and Zhao (2021)
Multiscale Filtering
In our CEEMD algorithm, the first few components have higher frequencies and the last few components have lower frequencies, and they all sum up to the original time series. Hence, by combining different components, CEEMD can be used as a filtering and reconstruction tool.
By removing the first few high-frequency components, we create a low-pass filter:

Likewise, a high-pass filter is created by removing the low-frequency components from the original time series.
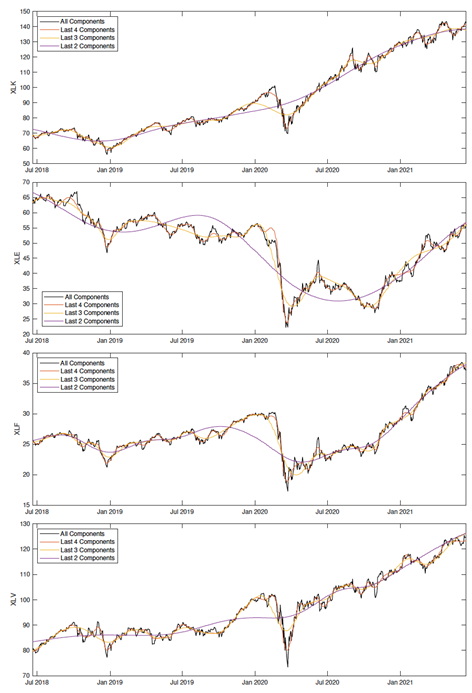
Time series of XLK, XLE, XLF, and XLV prices and their associated low-pass filters. Source: Leung and Zhao (2021)
Multiscale Volatility
We now examine the multiscale properties of volatility. The low-pass volatility and high-pass volatility are the standard deviations of the low-pass and high-pass returns.
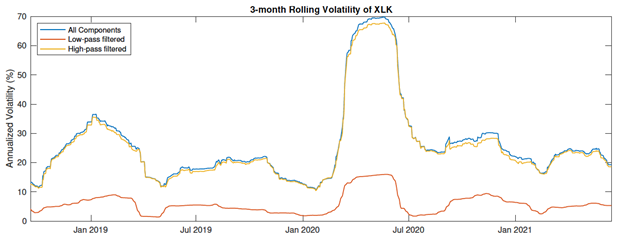
3-month rolling volatility of XLK. The high-pass filtered time series captures most of the volatility in the original times series. Source: Leung and Zhao (2021)
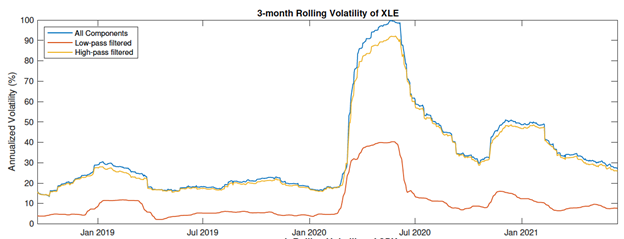
3-month rolling volatility of XLE. Source: Leung and Zhao (2021)
Volatility Asymmetry
It has been observed in the financial market that the volatility of asset returns is usually asymmetric, that is, the volatility is higher in a downside market than that in an upside market. We capture the asymmetry by looking at conditional volatility. Specifically, we examine whether asymmetry exists in the price dynamics. To that end, we define the conditional volatilities based on the CEEMD high-pass filters.
Some sector ETFs exhibit both directions of asymmetry, where upside and downside movements trigger high volatility alternately during different periods of time.
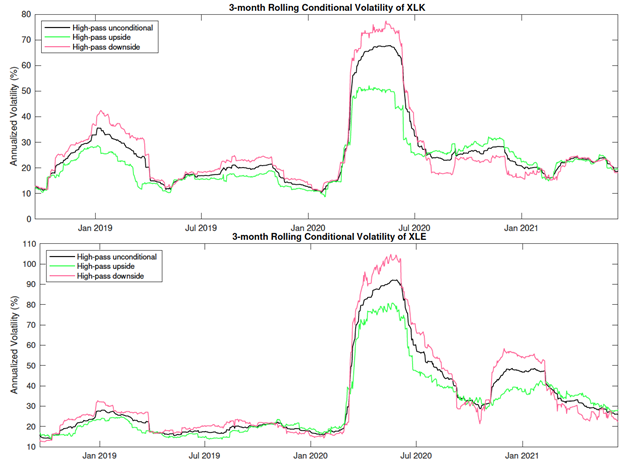
In the 2nd half of 2020, the upside volatility of XLK dominates its downside volatility. XLE started to experience the same in 2021. Source: Leung and Zhao (2021)
We compare the volatility asymmetry among all sector ETFs in the following plot:
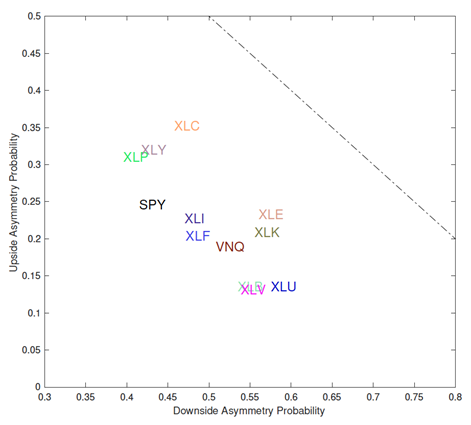
In the upper left region, the corresponding ETFs, such as XLP, XLY, and XLC, are upside volatility asymmetry dominated. In contrast, towards the lower right direction, the corresponding ETFs are downside volatility asymmetry dominated. The sector ETFs with the highest probability of downside asymmetry are XLU, XLE, XLK, XLV, and XLB. The S&P 500 index ETF, along with XLF and XLI, lie somewhere in the middle in terms of the upside/downside asymmetry. Source: Leung and Zhao (2021)
Disclaimer: It is not intended to be investment advice.
References
Huang et al. (1998), The empirical mode decomposition and the Hilbert spectrum for nonlinear and non-stationary time series analysis. Proceedings of the Royal Society of London. Series A: Mathematical, Physical and Engineering Sciences 454: 903–95
Leung and Zhao (2021), Multiscale Decomposition and Spectral Analysis of Sector ETF Price Dynamics [pdf], Vol. 14, Issue 10, p.464, Journal of Risk and Financial Management
Disclosure: Interactive Brokers
Information posted on IBKR Campus that is provided by third-parties does NOT constitute a recommendation that you should contract for the services of that third party. Third-party participants who contribute to IBKR Campus are independent of Interactive Brokers and Interactive Brokers does not make any representations or warranties concerning the services offered, their past or future performance, or the accuracy of the information provided by the third party. Past performance is no guarantee of future results.
This material is from Computational Finance & Risk Management, University of Washington and is being posted with its permission. The views expressed in this material are solely those of the author and/or Computational Finance & Risk Management, University of Washington and Interactive Brokers is not endorsing or recommending any investment or trading discussed in the material. This material is not and should not be construed as an offer to buy or sell any security. It should not be construed as research or investment advice or a recommendation to buy, sell or hold any security or commodity. This material does not and is not intended to take into account the particular financial conditions, investment objectives or requirements of individual customers. Before acting on this material, you should consider whether it is suitable for your particular circumstances and, as necessary, seek professional advice.