


This research article was originally posted at FactorResearch.
Seeking greener pastures
November 2021. Reading Time: 10 Minutes. Author: Nicolas Rabener.
SUMMARY
- The valuation of the S&P 500 depends on portfolio construction
- Analyst EPS projections are likely overly optimistic
- PEG ratios of other stock markets are more attractive
INTRODUCTION
Striking a bargain seems to bring joy to all people, regardless of their location and their beliefs. It is almost as if it was genetically coded into us to feel good about having acquired something below its intrinsic value. Accordingly, we become angry when overpaying or getting ripped off.
In some markets, the range of fair value of goods is narrow, eg paying $10 for a small bottle of spring water would seem expensive in almost all situations to most people. In other markets, fair value is a much more difficult concept. For example, is the S&P 500 cheap or expensive?
We could try to forecast the earnings of all the constituents of the S&P 500, assign terminal values, and discount these cash flows back to the present to derive a fair value. However, this requires multiple assumptions and these will vary from investor to investor. Fair value is very much in the eye of the beholder.
However, we can still try to create a high-level perspective by analyzing some of these major assumptions, and investigate if these are sensible, or not.
In this research note, we will lightly muse about the current valuation of the S&P 500.
CONTRASTING S&P 500 P/E MULTIPLES
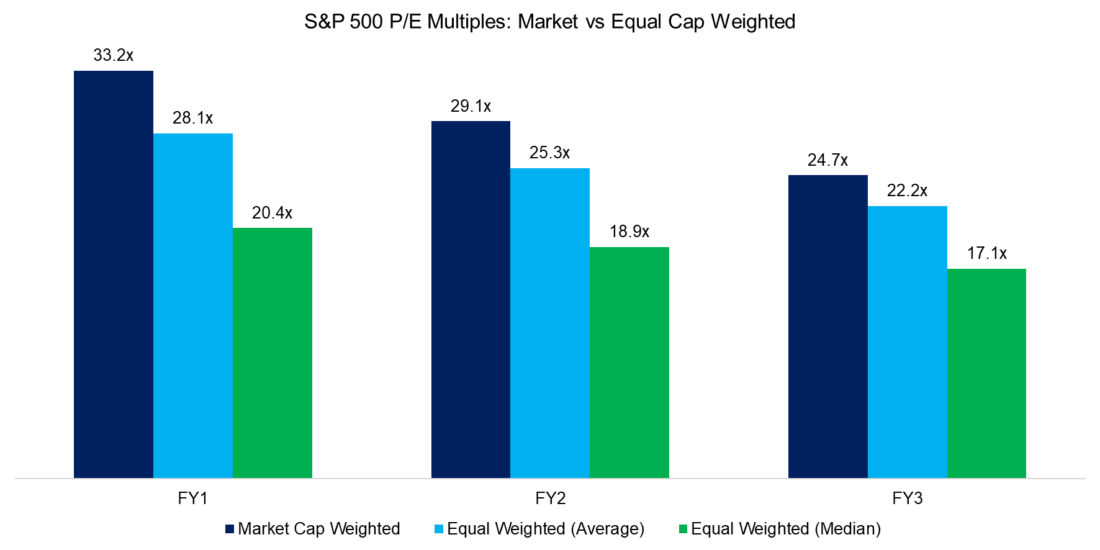
There are many ways to value the stock market like market capitalization-to-GDP, price-to-sales, Shiller price-to-earnings, and other ratios. We are going to focus on the simple price-to-earnings (“P/E”). However, this is more complicated than perhaps assumed. Should we take the current or forward P/E ratio? If forward, how far out do we want to go?
As usual in investing, we need to make assumptions. Given that the stock market is forward and not backward-looking, we should take expected rather than past earnings. Using Wall Street consensus analyst forecasts for earnings, we observe that the P/E ratios for the S&P 500 are expected to decrease from current levels in the coming years.
However, there is a significant difference between calculating P/E ratios using the market capitalization of stocks as weights, or equal-weighting stocks. Furthermore, there is a difference whether using the average or median for equal weight. The largest companies within the S&P 500 are trading at more expensive valuations than smaller companies, which is reflected in the P/E multiple being the highest when using market capitalization as a weighting scheme.
An investor might feel uncomfortable about buying the S&P 500 at a P/E multiple above 30, which is within the top 5% of the highest multiples since 1900, as expected long-term returns are inversely related to the entry multiple. However, this can be partially mitigated by constructing an equal-weighted portfolio of the S&P 500, which is available as an ETF.
Source: FactorResearch
S&P 500 EARNINGS GROWTH
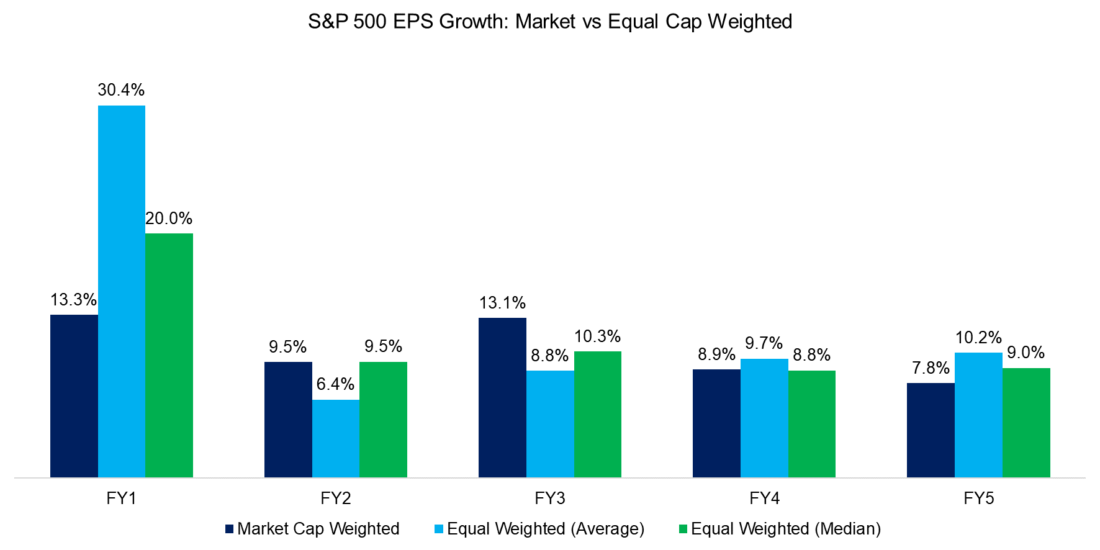
If analysts assume P/E multiples to decrease over time, then this is the result of higher expected earnings rather than forecasted lower share prices (they rarely dare that). The earnings growth is expected to be strong in the next financial year, which is likely based on the ongoing economic recovery from the COVID-19 crisis.
The outlook for EPS growth of the S&P 500 is rosy with consistent growth. Unfortunately, these forecasts are almost certain to be incorrect as analysts tend to be overly optimistic given conflicts of interests (corporate management does not appreciate Sell recommendations and there are more buyers than sellers of stocks).
The global economy constantly gets shocked by various events, which recently included the global pandemic, the outbreak of a volcano in Iceland, an earthquake and tsunami in Japan, subprime lending getting out hand in the US, and so on. Forecasting such events is perhaps futile, but they happen on a regular basis and the S&P 500 earnings are unlikely to grow consistently around 10% for the next four years.
Source: FactorResearch
RETURN OF CAPITAL
Instead of focusing too much on earning expectations, we can also ask simpler questions. If an investor invests in the 10-year US Treasury Note today, he will receive approximately 1.5% per annum plus his capital at maturity. Aside from a default of the US government, there is zero uncertainty on such an investment.
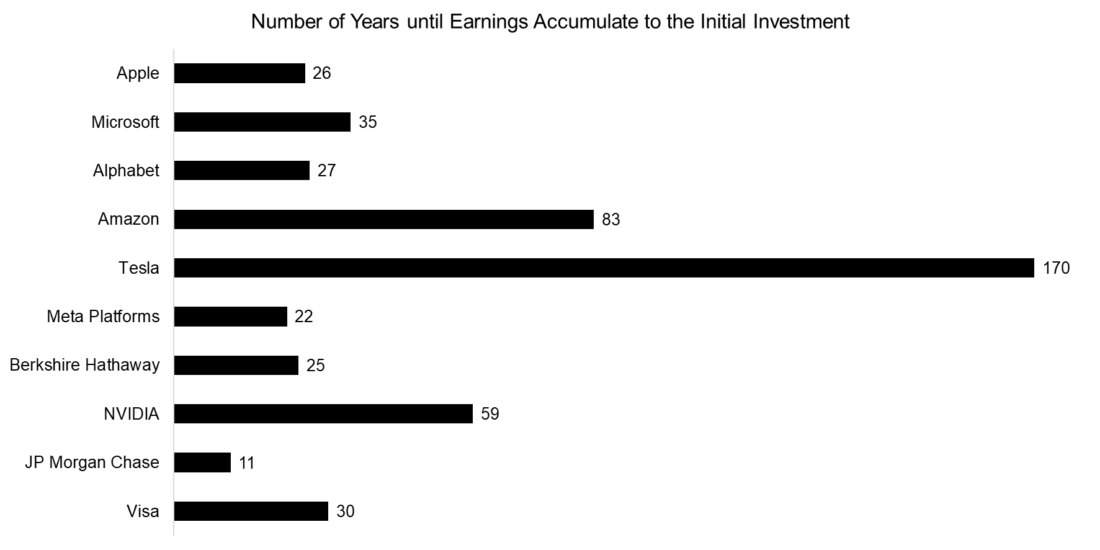
With stocks, there is much less certainty, and many stocks do not even pay a dividend, which means investors can only hope for capital appreciation. However, an investor can question how long it would take for the earnings of a company to accumulate to the initial investment, which is another perspective on the P/E ratio.
Analyzing the 10 largest stocks in the S&P 500 shows a quite heterogeneous picture based on the earnings expected for the next fiscal year. The shareholders of JP Morgan Chase only have to wait approximately a decade for their initial investment to be earned by the company, although it is worth mentioning that bank earnings are highly cyclical, which might make this significantly longer. In contrast, the investors in Tesla require close to 200 years for the earnings to accumulate to its market capitalization, which reflects a rather obscene valuation.
Source: FactorResearch
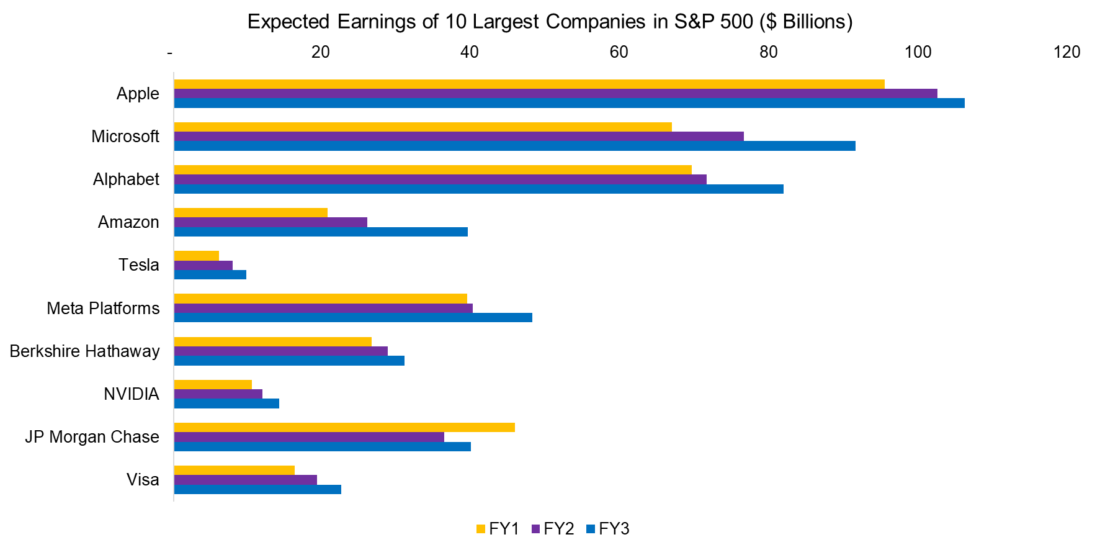
Naturally, Tesla investors can argue that the current valuation is high given high expected growth, but that does not seem to be the case. Analysts forecast earnings increasing from $6 billion in 2021 to $10 billion in 2025, which still implies exceptionally high forward multiples.
However, when considering the valuation of the S&P 500 investors should avoid focusing too much on a single stock, although it is worth highlighting that the top 10 stocks by market capitalization contribute 30% of the S&P 500, which is a record high. Almost all of these exceptionally successful companies are expected to grow their earnings significantly, which is not an easy accomplishment given the sheer magnitude of profits. Apple, Microsoft, and Alphabet are approaching $100 billion of earnings, also a record for listed companies.
Such large profits should be unsustainable in a free and fiercely competitive capital market like the USA as competitors should emerge. And indeed, there were plenty of other technology companies like Nokia or Blackberry that had exceptionally high market shares in the 2000s, but disappeared into oblivion.
Perhaps a few of these technology companies have achieved quasi-monopolistic industry positions given their size and platform-based business models that offer protection against competition, but they are not immune to economic downturns, changes in consumer preferences, or ambitious politicians eager to dismantle modern Standard Oil equivalents.
Source: FactorResearch
P/E MULTIPLES VS EPS GROWTH
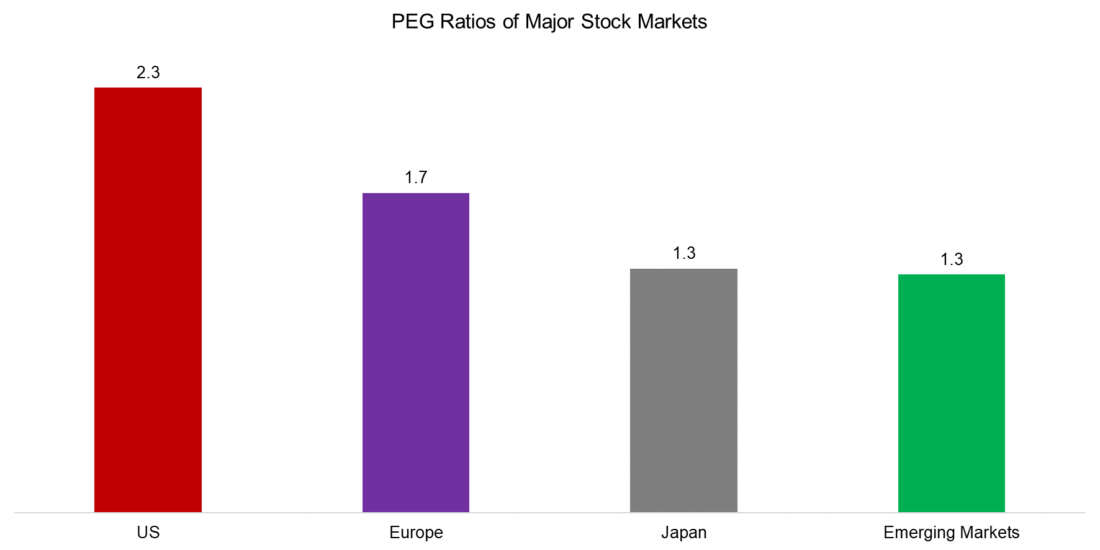
The most common argument for paying high multiples for US stocks is that these companies have the best growth prospects, compared to other markets. Although it depends on how the stock universes are defined, taking the 500 largest companies in the US, Europe, emerging markets, and 250 in Japan, the average EPS growth in the US is the lowest over the next five years.
The relationship between P/E ratios and earnings growth can be viewed via the P/E to EPS growth (PEG) ratio, which shows that the US stock market is less attractive than other markets given higher multiples and lower growth. Stocks are considered attractive when they feature a PEG ratio below, which unfortunately none of these markets exhibit.
Source: FactorResearch
FURTHER THOUGHTS
So, what do we conclude from this analysis?
Nothing new or insightful. The S&P 500 is expensive on a historical basis and analyst growth assumptions are overly optimistic, as always. The expected EPS growth of US stocks is less than required to make the US stock market attractive relative to other markets.
Given this, the logical conclusion would be to seek exposure to other stock markets, however, that would imply having no or low exposure to US stocks, especially the successful technology companies. Given their strong performance in recent years and the performance-chasing nature of most investors, this is more difficult done than said.
Disclosure: Interactive Brokers
Information posted on IBKR Campus that is provided by third-parties does NOT constitute a recommendation that you should contract for the services of that third party. Third-party participants who contribute to IBKR Campus are independent of Interactive Brokers and Interactive Brokers does not make any representations or warranties concerning the services offered, their past or future performance, or the accuracy of the information provided by the third party. Past performance is no guarantee of future results.
This material is from Finominal and is being posted with its permission. The views expressed in this material are solely those of the author and/or Finominal and Interactive Brokers is not endorsing or recommending any investment or trading discussed in the material. This material is not and should not be construed as an offer to buy or sell any security. It should not be construed as research or investment advice or a recommendation to buy, sell or hold any security or commodity. This material does not and is not intended to take into account the particular financial conditions, investment objectives or requirements of individual customers. Before acting on this material, you should consider whether it is suitable for your particular circumstances and, as necessary, seek professional advice.