


![[Gamma] Scalping Please](https://ibkrcampus.com/wp-content/smush-webp/2024/04/tir-featured-8-700x394.jpg.webp "[Gamma] Scalping Please")


Trade data in its raw form is tick by tick data, where each tick represents a trade. It is very useful, but it has far too much noise. In this blog, we convert this tick by tick (TBT) data into an OHLC (Open, High, Low, and Close) format using the resample function of the Pandas library.
We cover:
- What is Tick by Tick Data?
- What is OHLC Data?
- Converting tick by tick data to OHLC data
- Step 1 – Import pandas package
- Step 2 – Load the data
- Step 3 – Resample the data
What is Tick by Tick Data?
Before we go any further let’s understand what tick by tick data is. A single transaction between a buyer and a seller is represented by a tick.
In other words, when a buyer and a seller do the transection of the number of stocks on an agreed-upon price, it is represented by a tick. Multiple transactions of this type can happen under a second and each of them would be represented by a tick.
The tick by tick data looks like this.
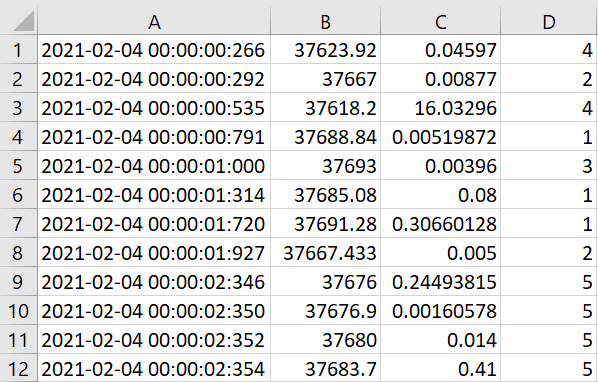
This data was downloaded from First Rate Data
The first column of the data is the date and time at which the trade occurred. The second column is the last traded price (LTP) and the third column is the number of bitcoins traded in that particular transaction that is the last traded quantity (LTQ).
And the last column is the exchange code. For this tutorial, we will use the bitcoin data of the fourth of February 2021. This data was downloaded from FirstRate Data.
We can add a section of a couple of suggested reads about the existing blogs on data, preprocessing, etc.
We can also add one paragraph about Pandas here and link it to our blog.
What is OHLC Data?
As we now know, the tick by tick data is very high-frequency data. What if we want to quickly check the moment of the price in 1 min, 10 mins or 1 day?
We would have to check each tick manually to check the price moment. This sounds burdensome, but it can actually be done very quickly if we summarise the data into open, high, low, and close prices.
Now we will walk through the whole process of converting the tick by tick data into OHLC format using the resample function from the pandas library.
Converting tick by tick data to OHLC data
One can convert tick by tick data to OHLC data using the following steps:
Step 1 – Import pandas package
Pandas is a popular Python package that is most widely used to handle tabular data. Pandas is used for important functions such as data wrangling, data manipulation, data analyses etc.
import pandas as pdimport_pandas.py hosted with ❤ by GitHubStep 2 – Load the data
Data is stored in my working directory with the name ‘BTC_2021-02-04.csv’. We are setting the Date time column as the index. As we saw earlier, the data is without a header. Hence we would add the header to the data while importing it. Thus importing and adding header takes place in the same line of code.
# Reading the data
data = pd.read_csv('BTC_2021-02-04.csv', names=['Date_Time', 'LTP', 'LTQ', 'Exchage Code'], index_col=0)
# Convert the index to datetime
data.index = pd.to_datetime(data.index, format='%Y-%m-%d %H:%M:%S:%f')
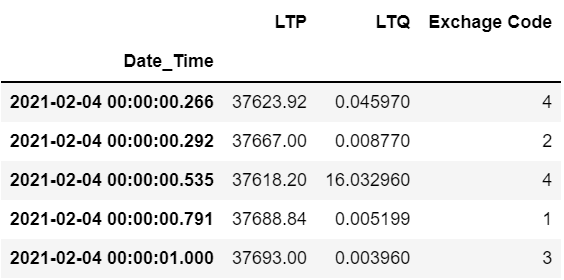
# Print the last 5 rows
data.head()read_tick_data_csv_file.py hosted with ❤ by GitHubThis is what the data frame looks like:-
Step 3 – Resample the data
We will now use the resample method of the pandas library. The resample method allows us to convert tick by tick data into OHLC format. We shall resample the data every 15 minutes and then divide it into OHLC format.
If you want to resample the data into smaller timeframes (milliseconds/microseconds/seconds), use L for milliseconds, U for microseconds, and S for seconds.
# Resample LTP column to 15 mins bars using resample function from pandas
resample_LTP = data['LTP'].resample('15Min').ohlc(_method='ohlc')

# Resample LTQ column to 15 mins bars using resample function from pandas
resample_LTQ = data['LTQ'].resample('15Min').sum()
resample_LTP.py hosted with ❤ by GitHubA snapshot of tick-by-tick data converted into OHLC format can be viewed with the following line of code:-
# Print the last 5 rows of resampled LTP
resample_LTP.head()
LTP_head.py hosted with ❤ by GitHub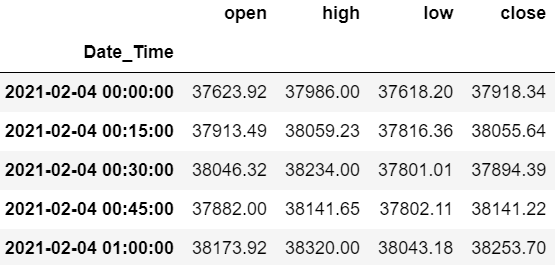
# Print the last 5 rows of resampled LTQ
resample_LTQ.head()
LTQ_head.py hosted with ❤ by GitHub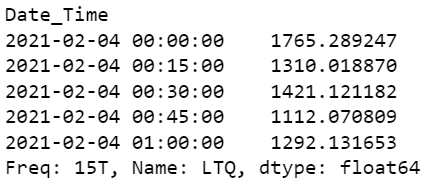
You may concatenate ask and bid price to have a combined data frame.
# Concatenate resampled data
resample_data = pd.concat([resample_LTP, resample_LTQ], axis=1,)

# Print the last 5 rows
resample_data.head()
resample_concat.py hosted with ❤ by GitHub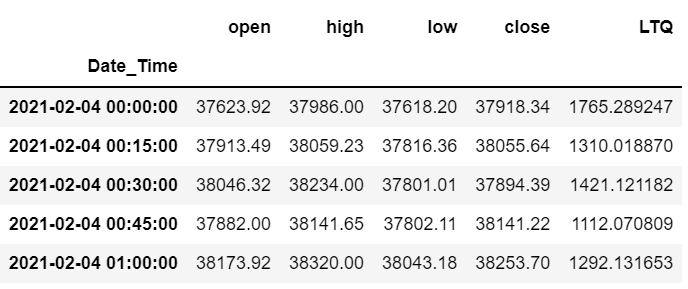
Conclusion
This blog described a quick way of computing the OHLC using TBT data. This can be applied across different assets and one can devise different strategies based on the OHLC data.
We can also plot charts based on OHLC and generate trade signals. Some other ways the data can be used are to build technical indicators in python or compute risk-adjusted returns.
Want to learn about algorithmic trading? Check out Quantra’s learning track on Algorithmic Trading for Everyone which is a set of 7 courses and covers a wide variety of topics such as Day Trading, Machine Learning, etc. Be sure to check it out!
For additional insight on this topic, see the full article here: https://blog.quantinsti.com/tick-tick-ohlc-data-pandas-tutorial/.
Disclaimer: All investments and trading in the stock market involve risk. Any decision to place trades in the financial markets, including trading in stock or options or other financial instruments is a personal decision that should only be made after thorough research, including a personal risk and financial assessment and the engagement of professional assistance to the extent you believe necessary. The trading strategies or related information mentioned in this article is for informational purposes only.
Disclosure: Interactive Brokers
Information posted on IBKR Campus that is provided by third-parties does NOT constitute a recommendation that you should contract for the services of that third party. Third-party participants who contribute to IBKR Campus are independent of Interactive Brokers and Interactive Brokers does not make any representations or warranties concerning the services offered, their past or future performance, or the accuracy of the information provided by the third party. Past performance is no guarantee of future results.
This material is from QuantInsti and is being posted with its permission. The views expressed in this material are solely those of the author and/or QuantInsti and Interactive Brokers is not endorsing or recommending any investment or trading discussed in the material. This material is not and should not be construed as an offer to buy or sell any security. It should not be construed as research or investment advice or a recommendation to buy, sell or hold any security or commodity. This material does not and is not intended to take into account the particular financial conditions, investment objectives or requirements of individual customers. Before acting on this material, you should consider whether it is suitable for your particular circumstances and, as necessary, seek professional advice.