

")


Excerpt
If we had to describe the usefulness of Principal Component Analysis, we would say that it helps us reduce the amount of data we have to analyse.
What is Principal Component Analysis?
Principal Component Analysis is one of the methods of ‘dimensionality’ reduction and in essence, it creates a new variable, which contains most of the information in the original variable. An example would be that if we are given 5 years of closing price data for 10 companies, i.e. approximately 1265 data points * 10. We would seek to reduce this number in such a way that the information is preserved.
Of course, in the real world, there would be some information loss and thus, we use the principal component analysis to make sure that it is kept to a minimum.
That sounds interesting, but how do we do this exactly?
The answer is ‘EigenValues’. Well, that’s not the whole answer but in a way it is. Before we get into the mathematics of it, let us refresh our concepts about the Matrix (no, not the movie!).
Eigen Vectors and Covariance Matrix
One of the major applications of Eigenvectors and Eigenvalues is in image transformations. Remember how we can tilt an image in any of the photo editing apps. Well, Eigenvalues and Eigenvectors helps us in this regard.
Basically, when we multiply a vector with a matrix, the vector gets transformed. By transformed we mean the direction and the magnitude of the vector might change. There are however some vectors for which the direction does not change. The magnitude might change however. So formally, this is what happens, for a transforming matrix A and a vector v:
Av = λv
The entire set of such vectors which do not change direction when multiplied with a matrix are called Eigen Vectors. The corresponding change in magnitude is called the Eigen Value. It is represented with λ here.
Remember how we said that the ultimate aim of the principal component analysis is to reduce the number of variables. Well, Eigenvectors and Eigenvalues help in this regard. One thing to follow is that Eigenvectors are for a square matrix i.e. a matrix with an equal number of rows and columns. But they can also be calculated for rectangular matrices.
Let’s say we have a matrix A, which consists of the following elements:
| 2 | 8 |
| 6 | 10 |
Now, we have to find the Eigenvectors and Eigenvalues in such a manner such that:
Av = λv
Where,
v is a matrix consisting of Eigenvectors, and
λ is the Eigenvalue
While it may sound daunting, but there is a simple method to find the Eigenvectors and Eigenvalues.
Let us modify the equation to the following,
Av = λIv (We know that AI = A)
If we bring the values from the R.H.S to the L.H.S, then,
Av – λIv = 0
Now, we will assume that the Eigenvector matrix is non-zero. Thus, we can find λ by finding the determinant.
Thus, | A – λI | = 0
(2 – λ)(10 – λ) – (8*6) = 0
20 – 2λ – 10λ +λ^2 – 48 = 0
-28 -12λ+ λ^2 = 0
λ^2 -12λ – 28 = 0
(λ – 14)(λ +2) = 0
λ = 14, -2
Thus, we can say that the Eigenvalues are 14, -2.
Taking the λ value as -2. We will now find the Eigenvector matrix.
Recall that, Av = λv
Let’s say that the Eigenvector matrix is as follows:
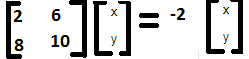
(2x + 6y) = -2x
(8x + 10y) = -2y
(4x + 6y) = 0
(8x + 12y) = 0
Since they are similar, solving them to get, 2x + 3y = 0, x = (-3/2)y
X = -3, y = 2
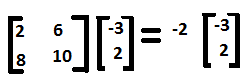
Thus, the Eigenvector matrix is
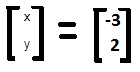
The entire equation can now be written in the following manner,
Similarly, for λ = 14, the Eigenvectors are x =1, y = 2
Visit QuantInsti to read the full article and download the code:
https://blog.quantinsti.com/principal-component-analysis-trading/
Disclosure: Interactive Brokers
Information posted on IBKR Campus that is provided by third-parties does NOT constitute a recommendation that you should contract for the services of that third party. Third-party participants who contribute to IBKR Campus are independent of Interactive Brokers and Interactive Brokers does not make any representations or warranties concerning the services offered, their past or future performance, or the accuracy of the information provided by the third party. Past performance is no guarantee of future results.
This material is from QuantInsti and is being posted with its permission. The views expressed in this material are solely those of the author and/or QuantInsti and Interactive Brokers is not endorsing or recommending any investment or trading discussed in the material. This material is not and should not be construed as an offer to buy or sell any security. It should not be construed as research or investment advice or a recommendation to buy, sell or hold any security or commodity. This material does not and is not intended to take into account the particular financial conditions, investment objectives or requirements of individual customers. Before acting on this material, you should consider whether it is suitable for your particular circumstances and, as necessary, seek professional advice.