


![[Gamma] Scalping Please](https://ibkrcampus.com/wp-content/smush-webp/2024/04/tir-featured-8-700x394.jpg.webp "[Gamma] Scalping Please")


2021 YTD factor update:
- After a challenging 2020 for many quants, Q1 2021 turned out to be one for the history books in a good way. In 2020, prominent funds at AQR & RenTech were reportedly down anywhere from -22 to -33%. While we saw the collateral damage in our Value related themes, it’s noteworthy that our stat arb proxy [Reversals ESB] finished 2020 at +109%, Enhanced Momentum at +40% & our flagship Sizzling Seven combo HF signal in double digit territory.
- QMIT’s Combo signals had a quarter with Val+Mo [aka GARP] leading the charge at +27.3% followed by our flagship Fabulous 14 at +23.5% on an EMN basis. Clearly one does not expect to annualize +27.3% (which would be +162.6%) for a market neutral signal. This quarter was proof positive that factor investing across a diversified & judiciously chosen spanning set can pay off in spades even amidst the tumultuous hand off from Growth to Value.
- Our Value composite led the charge at +20.3% thanks to DV at +28.9% which has staged a dramatic turnaround after multiple horrendous years. In much the same vein, Size jumped up to +18.1% YTD (beta neutral) given the resurgence of Small Cap Value particularly amongst Energy & Financials. We may finally get the year of Small Cap Value vs Large Cap Growth that seemed likely in Q4 of 2019 before Covid upended that thesis in Feb 2020.
- The Growth-Momentum complex which was the leader last year has lagged this year at +6.7% (beta neutral) or -4.9% ($ Neutral) particularly due to EnMom which was 2nd on the leaderboard last year clocking in at +40% but is now flattish YTD (beta neutral) while ARS & ART are down single digits.
- Quality has brought up the rear at -3% YTD due to Profitability at -23.4% ($ Neutral).
- From a Long Only perspective the performance has been even more impressive with Val+Mo [aka GARP] leading the charge at +32.3% followed by our flagship Fabulous 14 at +26.7% trouncing the SPX at+7.43% YTD. Given that the vast majority of investors are Long Only and many others are questioning the wisdom of shorting single names, it’s worth acknowledging the high octane nature of the Long side of our signals which have consistently delivered but been hamstrung by the shorts in recent years as a result of the Fed’s QE inspired melt up.
- The differential performance across our flagship signals is largely attributable to the differential weighting of ESBs like DV, Size, Efficiency & EQ which have had a disproportionate contribution YTD.
- We noted (rather presciently) in Dec 2020 that “$ neutrality is likely to remain quite challenging for EMN models (like 2009) largely on the short side because the model does not yet see in the numbers that the market is looking through Covid’s winter of discontent towards mass vaccinations & the resumption of normalcy.” We do know from decades of collective experience that around these inflection points, market neutral quant models tends to underperform (RenTech’s RIEF was down another -9.5% in Jan after -22% last year). We expected that being short the re-opening stocks [RCL AAL WYNN LVS …] would hurt as it did in the first half of Q1 till mid-Feb. This was manifest on the short side of ESBs such as EnMom, ARS & PROF which were – not surprisingly – the star performers last year. Such was the rotation out of the FANGs into deep value cyclicals as a result of the mid-Feb selloff (stemming from rate rise fears + re-opening + curve steepening) in the speculative low quality, long duration, growthy names that our Combo signals tend to be short. The damage was compounded in Jan by the Reddit/ WSB fueled speculative fervor or “short-busting” squeezes although SIRF spreads have now mostly recovered to only -1.6% (Beta neutral). When the double alpha kicked in this March with our long stock selection holding up while the speculative shorts tanked (particularly Cathy Wood related names), it boosted our alpha spreads to a historic outlier.
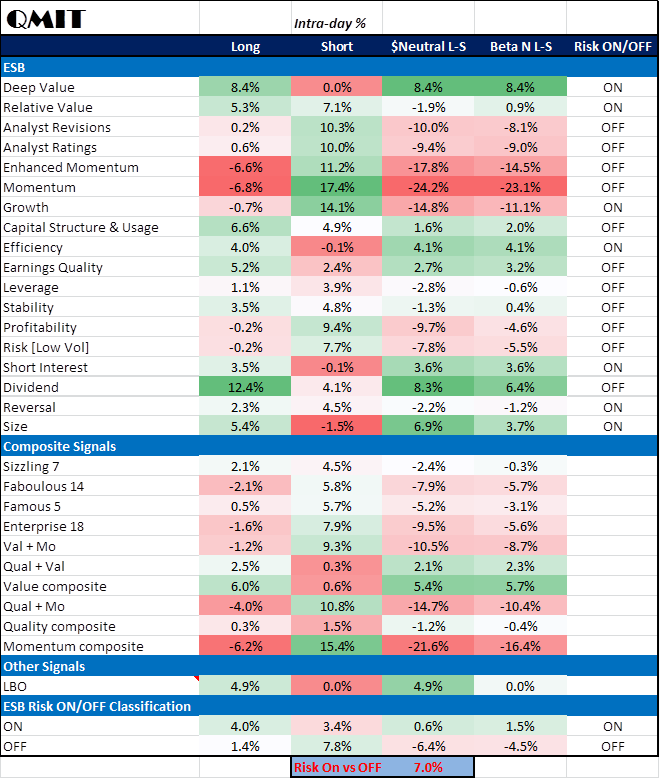
- ESB standouts YTD are Efficiency +39.6; DV 28.9; EQ 20.6 & Size 18.1% ($ Neutral). Given that we provide live ex-ante Top/ Bottom picks by ESB at month end, one can not only see the sorts of names that are driving Efficiency vs Profitability spreads etc but also independently verify the spread returns from those live position files.
- A consequence of thematic & factor plays dominating this year has been that our REVs (aka stat arb) ESB – which more than doubled last year to ring in +109% – has lost considerable steam but is still at a respectable +7.6% YTD (beta neutral).
- Larger firms are often justifiably skeptical about their ability to monetize our daily rebalanced spreads which are more amenable to smaller & nimbler hedge funds. To drive the point home about the attractiveness of returns even at the low monthly rebalancing frequency we highlight that the record outlier results we have been discussing above are based entirely on monthly rebalancing where transactions costs are de minimus at today’s institutional commissions. In fact our longer term LTD spreads for the first 19y from 2000-18 (which are still quite impressive) are based entirely on monthly rebalancing which is fairly consistent with out-sample live data published since 2019. Shockingly, our out-sample live results are often significantly higher than in-sample for ESBs because higher turnover ESBs such as ARS, ART, EnMom & Reversals are significantly disadvantaged at the monthly rebalancing horizon. Take for instance EnMom which compounded +40% last year or Reversals at +109% but for which we only show LT mean returns of +5.6% & +10.5% respectively (both Beta neutral).
- Beta vs $ neutrality continues to be topical in a generally bullish tape & we shall continue to harp on that particularly since for ESBs like Risk [aka Low Vol] & Stability it makes no sense to look at it any way other than in terms of Beta neutrality given the substantial beta mismatch.
- Sector rotation based on QMIT’s Combo Signals: We used to show the Sector ranks based only by ESBs before & leave the more explicit sector rotation based on combo signals to the imagination. With the addition of this latest feature it’s now easy to visualize how one may implement a Sector Rotation model based on our flagship combo signals. E.g., Fabulous 14 now shows Financials percolating up to the top followed by Industrials & Discretionary while IT, Healthcare & Utilities bring up the rear. In stark contrast to last year we see that Energy has moved up to the middle from the bottom; Industrials & Materials have risen several notches while IT & Healthcare have moved down several notches. Clearly, the bottom up aggregation of model scores seems to capture the zeitgeist.
- RORO spreads: By tracking the mean returns of the 7 Risk On vs 11 Risk Off ESBs we can succinctly capture the sentiment spread YTD which happens to lean +18.2% in favor of Risk On at +12% vs Risk Off at -6.1% thereby embodying the frothy tape in contrast to the what we saw during the Covid crash last year. A regime based approach has always been the holy grail of factor investing & the litmus test for our ex-ante RORO labels came about during the Covid crash when our Risk Off vs On ESBs registered ~+23% spread. Double validation of this approach was provided in the subsequent rebound (following the Fed’s actions on 3/23/20) during which period the RORO spreads flipped strongly in favor of Risk On vs Off.
- The decisive moment igniting the Great Val-Mo rotation came about with the announcement of Pfizer’s vaccine on Nov 9th, 2020. As one can see from the heatmap, this single day -24% crash in the Momentum factor was truly unprecedented (although our Enhanced mom fared better at -17.8% as designed to do). The +8.4% for Deep Value & +5.4% for our Value composite (which combines both Deep & Relative Value ESBs) were noteworthy in the positive direction. This GrowthMo ==> Value factor rotation of historic proportions was driven by a massive short squeeze amongst the Covid epicenter stocks like airlines, casinos, cruise lines etc. Our Risk ON ESBs led Risk OFF by +7% on this single day with most of the carnage coming from the short side of Risk OFF (due to the +7.8% short squeeze). The seminal factor moves of Nov 9th presaged the rotation that has continued since then into Value sectors such as Energy + Financials as well as the heavily shorted Covid epicenter names.
- Dampened oscillator – the magnitude of the short squeeze episodes substantially attenuated on successive vaccine Mondays in Nov 2020 as the rising case counts & vaccine news got priced in as per Tables below. The RORO single day spread response dropped from +7% to 2.8% for the Mon 11/16/20 episode instigated by Moderna’s vaccine news. The RORO return spread had completely fizzled out by the last Monday in Nov. Nov was a double whammy for many EMN signals in that even the long side of Risk OFF factors lagged significantly while the epicenter shorts were getting squeezed. Such an environment is often challenging for EMN in general as was witnessed by prominent fund failures last year.
- The -24% Momentum crash on 11/9/20 is highly reminiscent of the 2009 prolonged momentum crash caused by the V-shaped inflection point from the Mar 9th, 2009 lows.
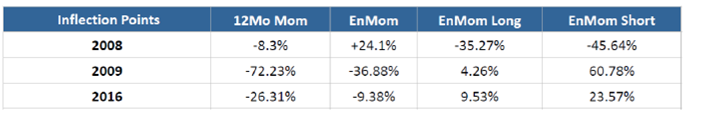
Pfizer (vaccine) Monday – Nov 9th, 2020 – Momentum crash
Stay tuned for Part II, which will feature the heatmaps.
To learn more about QuantZ/ QMIT and to get their factor research + heatmaps daily or even real-time, please get in touch! Milind has 25 years of market experience running prop desks as well as hedge funds & mutual funds at Merrill Lynch (now BlackRock), RBC & Deutsche Bank before starting QMIT. His publications have appeared in Risk, JoIM, Wiley, Elsevier etc. His educational background includes Oxford, Vassar, Carnegie Mellon & Wharton. He has also lectured, presented and/ or taught Capstone courses at Columbia, Carnegie Mellon, Courant, Georgia Tech, Johns Hopkins, Rutgers, NYU Tandon, UCSD, UCLA etc.
EXPLANATORY FOOTNOTES:
Sector Ranks are aggregated bottom up average ranks for each of the ESBs. Enhanced Smart Beta (ESB).
ESB portfolios are not sector neutral.
Generated weekly as of previous trading day’s close, this report shows the DTD, MTD, YTD and LTD spread returns for our ESBs.
ESB spreads are long-short based on top vs bottom 5%-tile (~125×125) of the largest liquid US traded stocks (usually ~2,500 depending upon market capitalization & minimum $ price criterion for stocks listed on NYSE & Nasdaq).
Certain industries like Biotechs and REITS are excluded due to event risk or because a generic quant model is not appropriate for those industries.
Daily vs Monthly rebalaning – Our Monthly Heatmaps are based on a T-1 month end optimization to solve for the optimal factor weights. While we use optimal factor weights based on month end optimization, in Daily Heatmaps, we refresh individual Factor Ranks on a daily basis therefore resulting in an intra-month varying Long/Short Portfolio. The optimal factor weights & selection of the “Best Flavor of the Month” is still static intra-month in order to prevent excessive turnover & unnecessarily noisy ESBs.
Dollar neutral vs Beta Neutral – Beta-neutrality implies daily de-levering of the higher beta side of the Long/Short factor portfolio. Indeed, the beta neutrality has to be enforced via daily rebalance since the factor ranks (& top/ bottom portfolios) are being refreshed daily.
MTD spread returns are geometrically chain-linked DTD spread returns where both are based on ESB portfolios formed at the prior month end close in the case of Monthly Heatmaps and formed at the prior trading day’s close in the case of Daily Heatmaps.
YTD & LTD returns are based on geometric chain-linking of monthlies without transaction costs or fees as is customary in the factor literature.
Multi-period spread returns are not the difference of cumulative top vs bottom returns. Instead, they represent the daily geometrically compounded rebalancing of the market neutral “active return” differential of the top vs bottom portfolios which is a more realistic representation.
Both Max Sharpe & Risk Parity optimization routines are based on a Hybrid methodology where we 1] find the optimal factor mix within the Smart Beta cohort based on signal blending/ “mixing” but 2] subsequently run the combined ESB spreads outsample on a fully “integrated” basis not just as the linear combination of factor returns.
Since liquid equity commissions are now de minimus for both the institutional & even the retail world and market impact is really a function of the investor’s AUM we simply leave out the impact of TCosts as is customary in factor research.
LTD data commences January 2000.
Enhanced Smart Beta Definitions
ARS: This smart beta composite shows our Analyst Revisions cohort based on measures of estimate revisions, dispersion, Standardized Unexpected Earnings surprise (SUE score) & consensus change in both earnings as well as revenues which can outperform traditional metrics like a 1mo consensus change.
ART: This smart beta composite shows our Analyst Ratings & Targets cohort based on measures of analyst recommendations, target price, changes & diffusion which can outperform traditional metrics like a 1mo consensus change.
CSU: This smart beta composite shows our Capital Structure/Usage cohort based on measures including Buybacks, Total yield, Capex, capital usage ratios etc which can outperform traditional metrics like Cash/MC.
Dividends: This smart beta composite shows our Dividends related cohort based on measures including Yield, payout, growth, forward yield etc which can outperform traditional metrics like Dividend Yield.
DV: This smart beta composite shows our Deep Value (or intrinsic value) cohort based on measures including tangible book & sales which can outperform traditional Book yield.
Efficiency: This smart beta composite shows our Efficiency cohort based on measures including Asset Turnover, Current Liabilities, Receivables etc which can outperform traditional metrics like Asset Turnover.
EnMOM: This smart beta composite shows our Enhanced Momentum cohort which can outperform traditional 12 month price momentum in both return & risk adjusted terms particularly at market inflection points.
EQ: This smart beta composite shows our Earnings Quality cohort based on a variety of Accrual measures which can outperform traditional metrics like Total Accruals.
Growth: This smart beta composite shows our Historical Growth cohort based on a variety of Earnings, Sales, Margins & CF related growth measures which can outperform traditional metrics like 3yr Sales growth.
Leverage: This smart beta composite shows our Leverage related cohort based on measures of Balance Sheet leverage which can outperform traditional metrics like Debt To Equity.
PMOM: This smart beta composite shows our PMOM related cohort which can outperform traditional 12 month price momentum using a variety of traditional momentum factors.
Profit: This smart beta composite shows our Profitability cohort based on measures like ROA, ROE, ROCE, ROTC, Margins etc which can outperform traditional metrics like ROE.
RV: This smart beta composite shows our Relative Value cohort based on measures of EPS, CFO, EBITDA etc which can outperform traditional Earnings yield.
Reversals: This smart beta composite shows our Reversals cohort which is comprised of metrics like short term reversals, RSI, DMA & other technical factors which can outperform traditional metrics like a 1 month total return.
Risk: This smart beta composite shows our Risk/ Low Vol cohort which is comprised of metrics like Beta, Low volatility etc.
SIRF: This smart beta composite shows our Short Interest cohort which is comprised of metrics related to Short Interest and its normalization by Float, trading volume etc.
Size: This smart beta composite shows our Size cohort which is comprised of metrics related to firm size including market capitalization.
Stability: This smart beta composite shows our Stability cohort which is comprised of metrics like Dispersion of EPS/ SPS estimates as well as the stability of Margins, EPS & CFs etc.
Disclosure: QMIT – QuantZ Machine Intelligence Technologies
QMIT is a data provider and not an investment advisor. This information has been prepared by QMIT for informational purposes only. This information should not be construed as investment, legal and/or tax advice. Additionally, this content is not intended as an offer to sell or a solicitation of any investment product or service. Opinions expressed are based on statistical forecasting from historical data. Past performance does not guarantee future performance. Further, the assumptions and the historical data based used could be erroneous. All results and analyses expressed are merely hypothetical and are NOT guaranteed. Trading securities involves substantial risk. Please consult a qualified investment advisor before risking any capital. The performance results for live portfolios following the screens presented herein may differ from the performance hypotheticals contained in this report for a variety of reasons, including differences related to transaction costs, market impact, fees, as well as differences in the time and price of execution. The performance results for individuals following the strategy could also differ based on differences in treatment of dividends received, including the amount received and whether and when such dividends were reinvested. We do not request personal information in any unsolicited email correspondence from our customers. Any correspondence offering trading advice or unsolicited message asking for personal details should be treated as fraudulent and reported to QMIT. Neither QMIT nor its third-party content providers shall be liable for any errors, inaccuracies or delays in content, or for any actions taken in reliance thereon. QMIT EXPRESSLY DISCLAIMS ALL WARRANTIES, EXPRESSED OR IMPLIED, AS TO THE ACCURACY OF ANY THE CONTENT PROVIDED, OR AS TO THE FITNESS OF THE INFORMATION FOR ANY PURPOSE. Although QMIT makes reasonable efforts to obtain reliable content from third parties, QMIT does not guarantee the accuracy of or endorse the views or opinions given by any third-party content provider. All content herein is owned by QuantZ Machine Intelligence Technologies and/ or its affiliates and protected by United States and international copyright laws. QMIT content may not be reproduced, transmitted or distributed without the prior written consent of QMIT.
Disclosure: Interactive Brokers
Information posted on IBKR Campus that is provided by third-parties does NOT constitute a recommendation that you should contract for the services of that third party. Third-party participants who contribute to IBKR Campus are independent of Interactive Brokers and Interactive Brokers does not make any representations or warranties concerning the services offered, their past or future performance, or the accuracy of the information provided by the third party. Past performance is no guarantee of future results.
This material is from QMIT – QuantZ Machine Intelligence Technologies and is being posted with its permission. The views expressed in this material are solely those of the author and/or QMIT – QuantZ Machine Intelligence Technologies and Interactive Brokers is not endorsing or recommending any investment or trading discussed in the material. This material is not and should not be construed as an offer to buy or sell any security. It should not be construed as research or investment advice or a recommendation to buy, sell or hold any security or commodity. This material does not and is not intended to take into account the particular financial conditions, investment objectives or requirements of individual customers. Before acting on this material, you should consider whether it is suitable for your particular circumstances and, as necessary, seek professional advice.
Disclosure: Hedge Funds
Hedge Funds are highly speculative, and investors may lose their entire investment.
Disclosure: Margin Trading
Trading on margin is only for sophisticated investors with high risk tolerance. You may lose more than your initial investment. For additional information regarding margin loan rates, see ibkr.com/interest