


![[Gamma] Scalping Please](https://ibkrcampus.com/wp-content/smush-webp/2024/04/tir-featured-8-700x394.jpg.webp "[Gamma] Scalping Please")


Read the 2021 YTD factor update commentary in Part I. Part II will present the Heatmaps.
NB All heatmaps below are as of 2021-03-31
$ Neutral – Monthly rebalanced – Combo signals YTD:
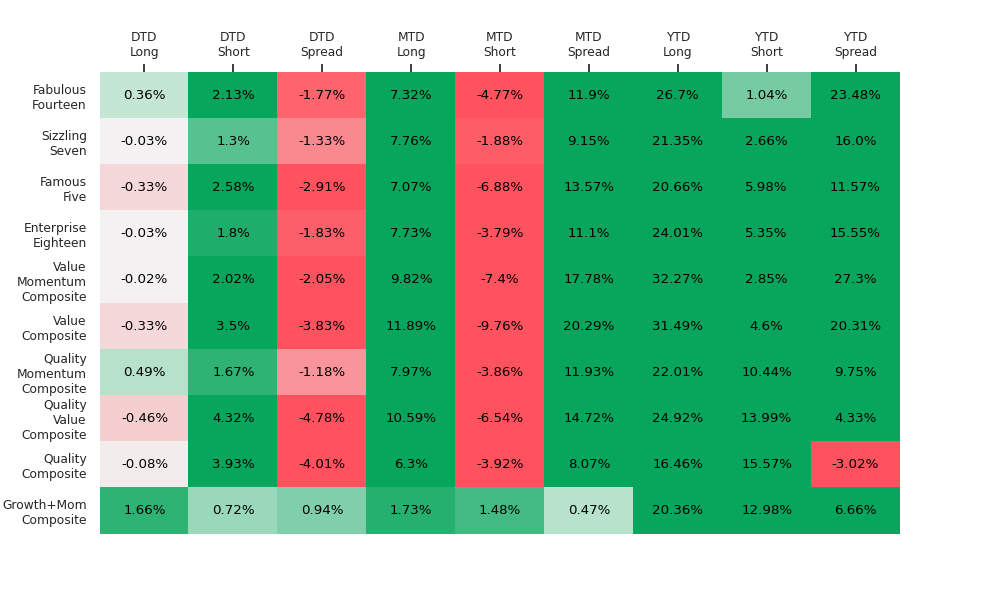
Chart Sources: Factset, QMIT. For details, see QMIT disclaimers.
$ Neutral – Daily heatmap – ESBs YTD:
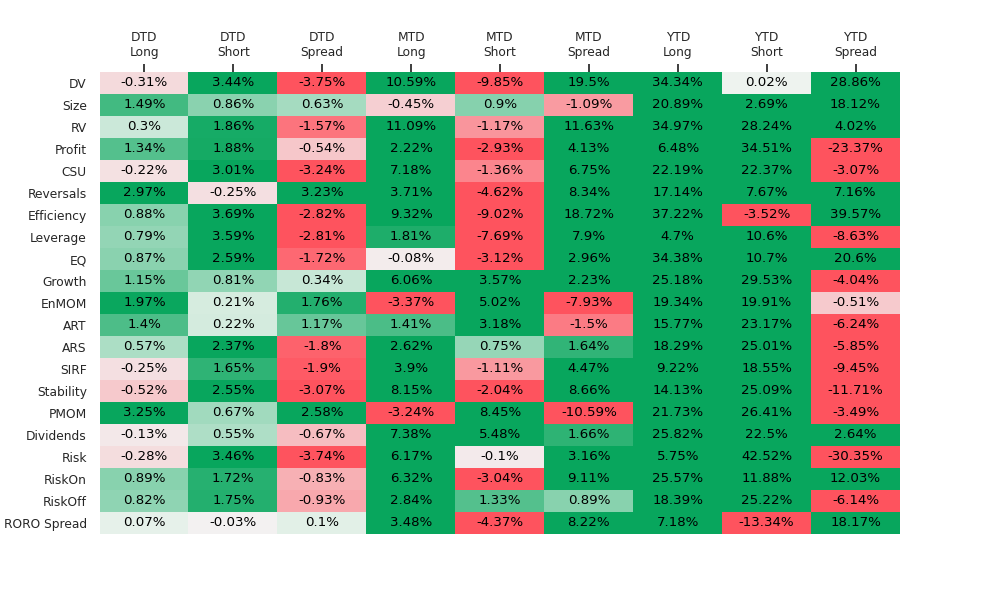
Chart Sources: Factset, QMIT. For details, see QMIT disclaimers.
Beta neutral – Daily heatmap – ESBs YTD:
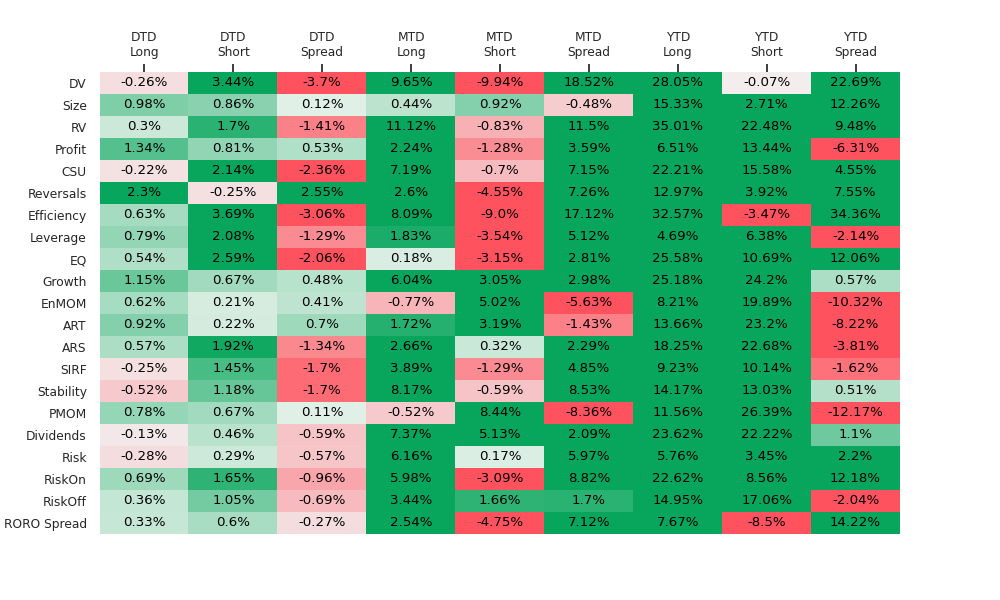
Chart Sources: Factset, QMIT. For details, see QMIT disclaimers.
$ Neutral – 19y Monthly + Daily (thereafter) heatmap – ESBs LTD:
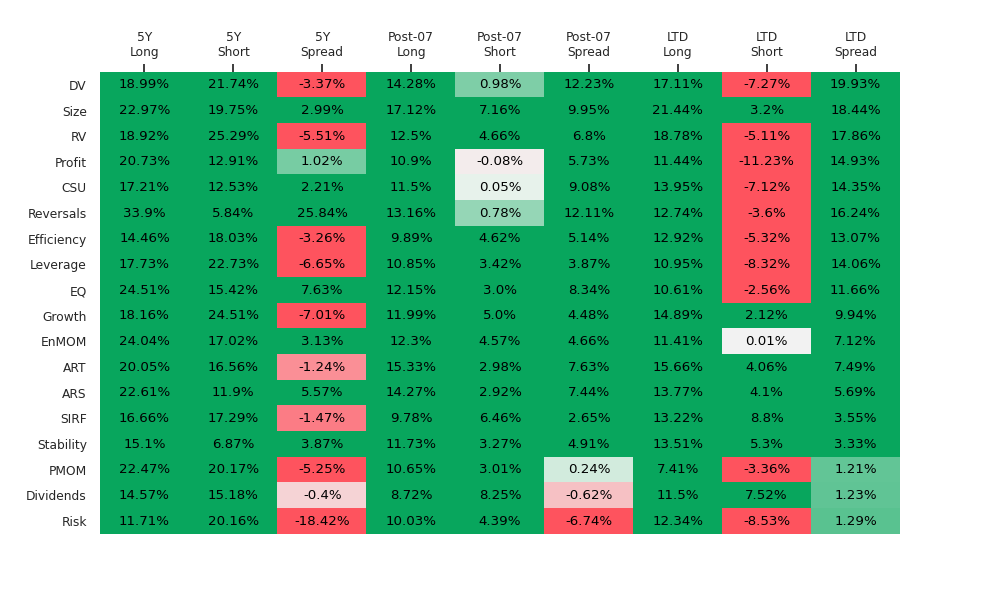
Chart Sources: Factset, QMIT. For details, see QMIT disclaimers.
Sector ranks based on QMIT Combo Signals:
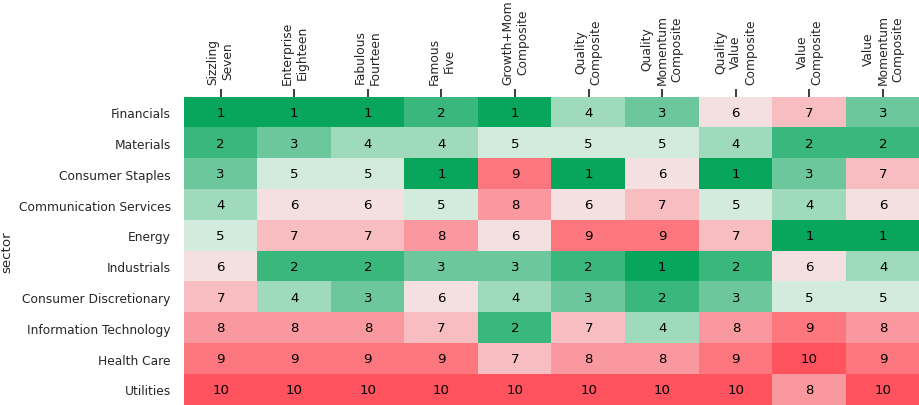
Chart Sources: Factset, QMIT. For details, see QMIT disclaimers.
Sector ranks based on QMIT Enhanced Smart Betas:
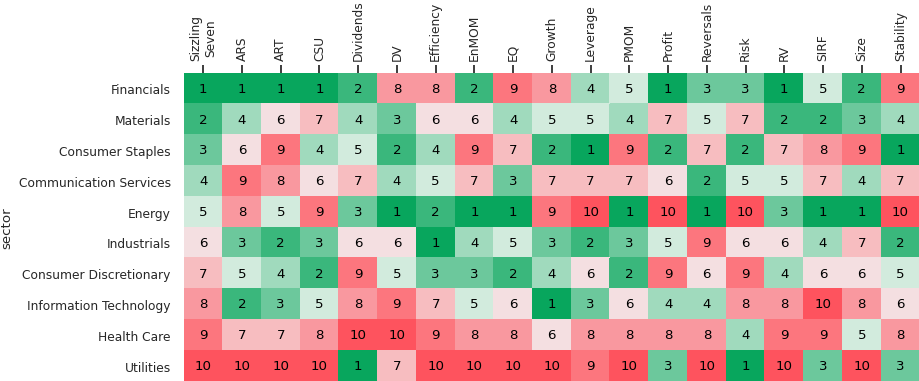
Chart Sources: Factset, QMIT. For details, see QMIT disclaimers.
20y Return correlations for QMIT Enhanced Smart Betas:
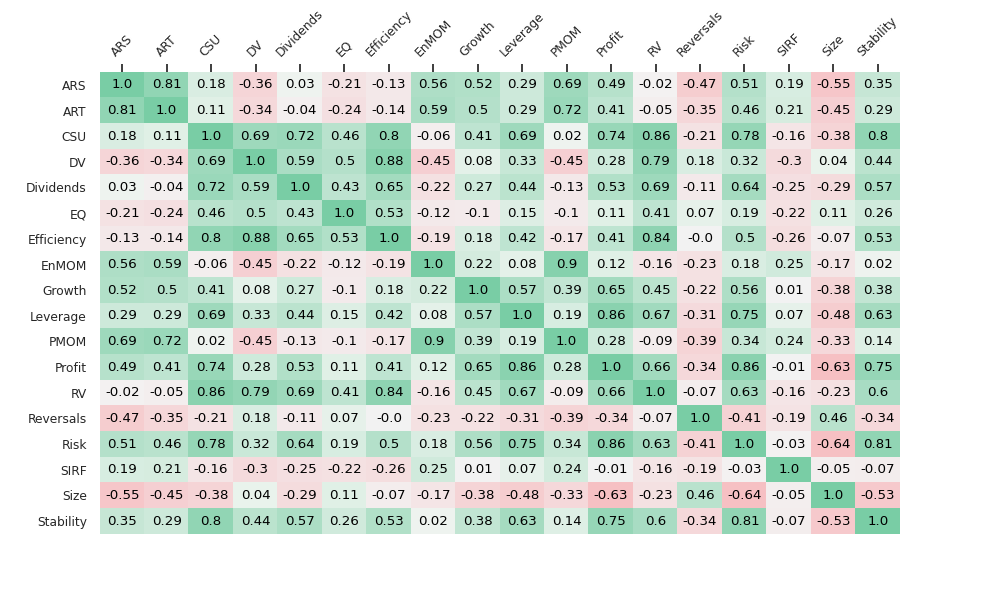
Chart Sources: Factset, QMIT. For details, see QMIT disclaimers.
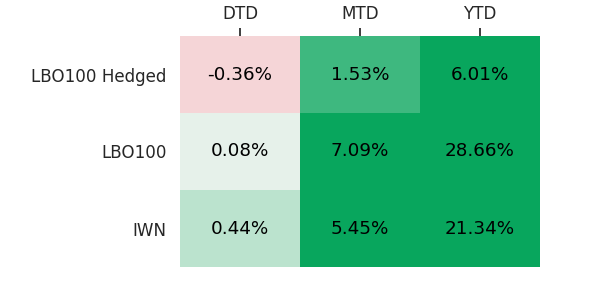
Small-cap deep value names are clearly en vogue & were largely impervious to the sharp sell-off in the speculative growthy Nasdaq names earlier in March which were at the epicenter of the market froth. The spectacular tripling of the LBO Top100 (long only) portfolio from the Covid lows of March 24th 2020 is reminiscent of the +84% return in 2009 and consistent with numerous k-baggers off of the Covid lows LTM.
$ Neutral – Weekly rebalanced YTD [daily geometric chain-linked returns]:
| Month | Top100 | Hedged w/ IWN |
| 2020-03 Stub | 18.63% | 3.51% |
| 2020-04 | 22.29% | 9.30% |
| 2020-05 | 9.00% | 5.85% |
| 2020-06 | 6.10% | 3.25% |
| 2020-07 | 2.39% | 0.36% |
| 2020-08 | 7.27% | 1.81% |
| 2020-09 | -2.28% | 2.50% |
| 2020-10 | 4.87% | 1.11% |
| 2020-11 | 20.74% | 1.23% |
| 2020-12 | 7.46% | -0.50% |
| 2021-01 | 7.93% | 2.76% |
| 2021-02 | 11.31% | 1.61% |
| 2021-03 | 7.09% | 1.53% |
| Comp Geom | 215.22% | 39.80% |
Chart Sources: Factset, QMIT. For details, see QMIT disclaimers.
To learn more about QuantZ/ QMIT and to get their factor research + heatmaps daily or even real-time, please get in touch! Milind has 25 years of market experience running prop desks as well as hedge funds & mutual funds at Merrill Lynch (now BlackRock), RBC & Deutsche Bank before starting QMIT. His publications have appeared in Risk, JoIM, Wiley, Elsevier etc. His educational background includes Oxford, Vassar, Carnegie Mellon & Wharton. He has also lectured, presented and/ or taught Capstone courses at Columbia, Carnegie Mellon, Courant, Georgia Tech, Johns Hopkins, Rutgers, NYU Tandon, UCSD, UCLA etc.
EXPLANATORY FOOTNOTES:
Sector Ranks are aggregated bottom up average ranks for each of the ESBs. Enhanced Smart Beta (ESB).
ESB portfolios are not sector neutral.
Generated weekly as of previous trading day’s close, this report shows the DTD, MTD, YTD and LTD spread returns for our ESBs.
ESB spreads are long-short based on top vs bottom 5%-tile (~125×125) of the largest liquid US traded stocks (usually ~2,500 depending upon market capitalization & minimum $ price criterion for stocks listed on NYSE & Nasdaq).
Certain industries like Biotechs and REITS are excluded due to event risk or because a generic quant model is not appropriate for those industries.
Daily vs Monthly rebalaning – Our Monthly Heatmaps are based on a T-1 month end optimization to solve for the optimal factor weights. While we use optimal factor weights based on month end optimization, in Daily Heatmaps, we refresh individual Factor Ranks on a daily basis therefore resulting in an intra-month varying Long/Short Portfolio. The optimal factor weights & selection of the “Best Flavor of the Month” is still static intra-month in order to prevent excessive turnover & unnecessarily noisy ESBs.
Dollar neutral vs Beta Neutral – Beta-neutrality implies daily de-levering of the higher beta side of the Long/Short factor portfolio. Indeed, the beta neutrality has to be enforced via daily rebalance since the factor ranks (& top/ bottom portfolios) are being refreshed daily.
MTD spread returns are geometrically chain-linked DTD spread returns where both are based on ESB portfolios formed at the prior month end close in the case of Monthly Heatmaps and formed at the prior trading day’s close in the case of Daily Heatmaps.
YTD & LTD returns are based on geometric chain-linking of monthlies without transaction costs or fees as is customary in the factor literature.
Multi-period spread returns are not the difference of cumulative top vs bottom returns. Instead, they represent the daily geometrically compounded rebalancing of the market neutral “active return” differential of the top vs bottom portfolios which is a more realistic representation.
Both Max Sharpe & Risk Parity optimization routines are based on a Hybrid methodology where we 1] find the optimal factor mix within the Smart Beta cohort based on signal blending/ “mixing” but 2] subsequently run the combined ESB spreads outsample on a fully “integrated” basis not just as the linear combination of factor returns.
Since liquid equity commissions are now de minimus for both the institutional & even the retail world and market impact is really a function of the investor’s AUM we simply leave out the impact of TCosts as is customary in factor research.
LTD data commences January 2000.
Enhanced Smart Beta Definitions
ARS: This smart beta composite shows our Analyst Revisions cohort based on measures of estimate revisions, dispersion, Standardized Unexpected Earnings surprise (SUE score) & consensus change in both earnings as well as revenues which can outperform traditional metrics like a 1mo consensus change.
ART: This smart beta composite shows our Analyst Ratings & Targets cohort based on measures of analyst recommendations, target price, changes & diffusion which can outperform traditional metrics like a 1mo consensus change.
CSU: This smart beta composite shows our Capital Structure/Usage cohort based on measures including Buybacks, Total yield, Capex, capital usage ratios etc which can outperform traditional metrics like Cash/MC.
Dividends: This smart beta composite shows our Dividends related cohort based on measures including Yield, payout, growth, forward yield etc which can outperform traditional metrics like Dividend Yield.
DV: This smart beta composite shows our Deep Value (or intrinsic value) cohort based on measures including tangible book & sales which can outperform traditional Book yield.
Efficiency: This smart beta composite shows our Efficiency cohort based on measures including Asset Turnover, Current Liabilities, Receivables etc which can outperform traditional metrics like Asset Turnover.
EnMOM: This smart beta composite shows our Enhanced Momentum cohort which can outperform traditional 12 month price momentum in both return & risk adjusted terms particularly at market inflection points.
EQ: This smart beta composite shows our Earnings Quality cohort based on a variety of Accrual measures which can outperform traditional metrics like Total Accruals.
Growth: This smart beta composite shows our Historical Growth cohort based on a variety of Earnings, Sales, Margins & CF related growth measures which can outperform traditional metrics like 3yr Sales growth.
Leverage: This smart beta composite shows our Leverage related cohort based on measures of Balance Sheet leverage which can outperform traditional metrics like Debt To Equity.
PMOM: This smart beta composite shows our PMOM related cohort which can outperform traditional 12 month price momentum using a variety of traditional momentum factors.
Profit: This smart beta composite shows our Profitability cohort based on measures like ROA, ROE, ROCE, ROTC, Margins etc which can outperform traditional metrics like ROE.
RV: This smart beta composite shows our Relative Value cohort based on measures of EPS, CFO, EBITDA etc which can outperform traditional Earnings yield.
Reversals: This smart beta composite shows our Reversals cohort which is comprised of metrics like short term reversals, RSI, DMA & other technical factors which can outperform traditional metrics like a 1 month total return.
Risk: This smart beta composite shows our Risk/ Low Vol cohort which is comprised of metrics like Beta, Low volatility etc.
SIRF: This smart beta composite shows our Short Interest cohort which is comprised of metrics related to Short Interest and its normalization by Float, trading volume etc.
Size: This smart beta composite shows our Size cohort which is comprised of metrics related to firm size including market capitalization.
Stability: This smart beta composite shows our Stability cohort which is comprised of metrics like Dispersion of EPS/ SPS estimates as well as the stability of Margins, EPS & CFs etc.
Disclosure: QMIT – QuantZ Machine Intelligence Technologies
QMIT is a data provider and not an investment advisor. This information has been prepared by QMIT for informational purposes only. This information should not be construed as investment, legal and/or tax advice. Additionally, this content is not intended as an offer to sell or a solicitation of any investment product or service. Opinions expressed are based on statistical forecasting from historical data. Past performance does not guarantee future performance. Further, the assumptions and the historical data based used could be erroneous. All results and analyses expressed are merely hypothetical and are NOT guaranteed. Trading securities involves substantial risk. Please consult a qualified investment advisor before risking any capital. The performance results for live portfolios following the screens presented herein may differ from the performance hypotheticals contained in this report for a variety of reasons, including differences related to transaction costs, market impact, fees, as well as differences in the time and price of execution. The performance results for individuals following the strategy could also differ based on differences in treatment of dividends received, including the amount received and whether and when such dividends were reinvested. We do not request personal information in any unsolicited email correspondence from our customers. Any correspondence offering trading advice or unsolicited message asking for personal details should be treated as fraudulent and reported to QMIT. Neither QMIT nor its third-party content providers shall be liable for any errors, inaccuracies or delays in content, or for any actions taken in reliance thereon. QMIT EXPRESSLY DISCLAIMS ALL WARRANTIES, EXPRESSED OR IMPLIED, AS TO THE ACCURACY OF ANY THE CONTENT PROVIDED, OR AS TO THE FITNESS OF THE INFORMATION FOR ANY PURPOSE. Although QMIT makes reasonable efforts to obtain reliable content from third parties, QMIT does not guarantee the accuracy of or endorse the views or opinions given by any third-party content provider. All content herein is owned by QuantZ Machine Intelligence Technologies and/ or its affiliates and protected by United States and international copyright laws. QMIT content may not be reproduced, transmitted or distributed without the prior written consent of QMIT.
Disclosure: Interactive Brokers
Information posted on IBKR Campus that is provided by third-parties does NOT constitute a recommendation that you should contract for the services of that third party. Third-party participants who contribute to IBKR Campus are independent of Interactive Brokers and Interactive Brokers does not make any representations or warranties concerning the services offered, their past or future performance, or the accuracy of the information provided by the third party. Past performance is no guarantee of future results.
This material is from QMIT – QuantZ Machine Intelligence Technologies and is being posted with its permission. The views expressed in this material are solely those of the author and/or QMIT – QuantZ Machine Intelligence Technologies and Interactive Brokers is not endorsing or recommending any investment or trading discussed in the material. This material is not and should not be construed as an offer to buy or sell any security. It should not be construed as research or investment advice or a recommendation to buy, sell or hold any security or commodity. This material does not and is not intended to take into account the particular financial conditions, investment objectives or requirements of individual customers. Before acting on this material, you should consider whether it is suitable for your particular circumstances and, as necessary, seek professional advice.
Disclosure: Margin Trading
Trading on margin is only for sophisticated investors with high risk tolerance. You may lose more than your initial investment. For additional information regarding margin loan rates, see ibkr.com/interest