


In in the first installment, Rekhit discussed Steps 1-2: Closing Price, Changes in Closing Price and Gain and Loss.
Step 4: Average Gain and Loss
In the RSI indicator, to smoothen the price movement, we take an average of the gains (and losses) for a certain period.
While we call it an average, a little explanation would be needed. For the first 14 periods, it is a simple average of the values.
To explain it, we will look at the average gain column.
Thus, in the table, the first 14 values would be from (25-04) to (14-05) which is, (0.00 + 4.79 + 8.60 + 0.00 + 6.02 + 1.23 + 0.00 + 9.64 + 8.68 + 0.00 + 4.88 + 0.00 + 0.00 + 0.00)/14 = 3.13.
Now, since we are placing more emphasis on the recent values, for the next set of values, we use the following formula,
[(Previous avg. gain)*13)+ current gain)]/14.Thus, for (15-05), we will calculate the average gain as [(3.13*13)+0.00]/14 = 2.91.
Similarly, we will calculate the average Loss, too.
Based on these formulae, the table is updated for the columns “Avg Gain (5)” and “Avg Loss (6)”.
Step 5: Calculate RS
Now, to make matters simple, we add a column called “RS”, which is simply (Avg Gain)/(Avg Loss). Thus, for 14-05, RS = (Avg Gain)/(Avg Loss) = 3.13/2.52 = 1.24.
In this manner, the table for the column “RS (7)” is updated. In the next step, we finally work out the RSI values.
Step 6: Calculation of RSI
RSI = [100 - (100/{1+ RS})].For example, for (14-05),
RSI = [100 – (100/{1+ RS})] = [100 – (100/{1+ 1.24})] = 55.37.
In this manner, the table is updated.
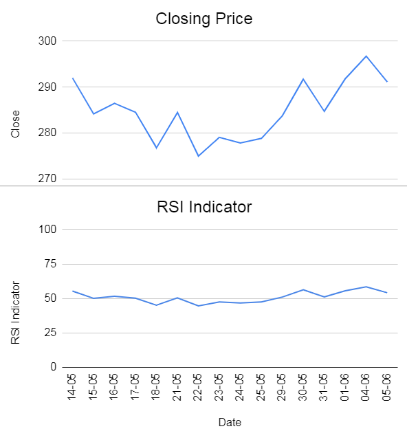
This is how we get the value of RSI. The RSI indicator graph is always created with respect to the closing price. For example, if we take into account the values of RSI in the above table, the graph should be as follows:
While the formula for RSI mentioned here is generally accepted, we can have certain variations on the formula based on the weightage given to the Average gain or loss values. It is a known fact that as the number of data points increase, the RSI Indicator gets better at gauging the market. Certain sources recommend at least 250 data points before you start making trading decisions on them.
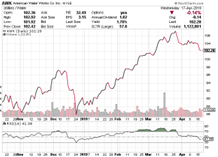
One of the reasons why the RSI indicator is popular is because its value is always between 0 and 100. This makes it easy to read and form opinions about the asset. Furthermore, it is generally accepted that a value below 30 indicates “oversold,” while a value over 70 indicates “overbought”.
However, it is not as easy as it looks, and if we try to enter and exit the market based on this factor alone, we would not be able to trade effectively, as there are numerous occasions where this advice can fail. You can see in the graph below that the closing price continued to rise even after entering the overbought zone from March 19 to April 25.
In the next article, Rekhit will discuss few strategies based on the RSI indicator.
Disclosure: Interactive Brokers
Information posted on IBKR Campus that is provided by third-parties does NOT constitute a recommendation that you should contract for the services of that third party. Third-party participants who contribute to IBKR Campus are independent of Interactive Brokers and Interactive Brokers does not make any representations or warranties concerning the services offered, their past or future performance, or the accuracy of the information provided by the third party. Past performance is no guarantee of future results.
This material is from QuantInsti and is being posted with its permission. The views expressed in this material are solely those of the author and/or QuantInsti and Interactive Brokers is not endorsing or recommending any investment or trading discussed in the material. This material is not and should not be construed as an offer to buy or sell any security. It should not be construed as research or investment advice or a recommendation to buy, sell or hold any security or commodity. This material does not and is not intended to take into account the particular financial conditions, investment objectives or requirements of individual customers. Before acting on this material, you should consider whether it is suitable for your particular circumstances and, as necessary, seek professional advice.