


![[Gamma] Scalping Please](https://ibkrcampus.com/wp-content/smush-webp/2024/04/tir-featured-8-700x394.jpg.webp "[Gamma] Scalping Please")


Part I of Feb 10, 2020 will recap January 2020.
Stay tuned for Part II of Feb 10, 2020 commentary, which will focus on The Sector ranks table and heatmaps with the DTD, MTD, YTD, 5 year, Post-07 & LTD returns for our ESBs.
- Following the explosive factor moves in Jan 2020 (which were really a continuation of 2019 thematically), the first week of Feb 2020 was rather different due to a combination of earnings and the CoronaVirus scare.
- Despite the market ending substantially higher for the week at +3.2% on the SPY, there was a huge rotation beneath the surface. We witnessed a major Val-Mo rotation on Feb 5th with Value & Reversals up as much as +4% driven by the bounce in Energy vs PMOM & Risk down ~-2% ($ neutral) as the growthy tech names sold off. It remains to be seen whether there is a catalyst for a sustained move as it fizzled out Thursday/ Friday especially in light of the payroll number. By the end of the week after the reversal faded we only saw ~+2% for DV (Deep Value) & Reversals and ~+1% Analyst Ratings (ART) & CSU with -1.4% for Enhanced Momentum ($ neutral).
- Key catalyst for Value remains the steepness of the curve for financials & cyclicals to ignite which will depend on overall confidence in economic growth & sentiment regarding the economy.
- We wanted to dive a bit deeper into our rationale behind a potential Value-Momentum rotation. Value has performed extraordinarily well vs Momentum over the past 2 decades particularly given the benefit of starting near the beginning of the NASDAQ crash in 2000. However, the dramatic underperformance over the past 5 years is similar to that of the late 90s dot com era & it has substantially narrowed the outperformance gap.
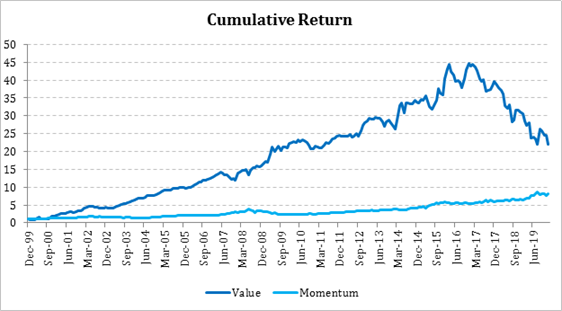
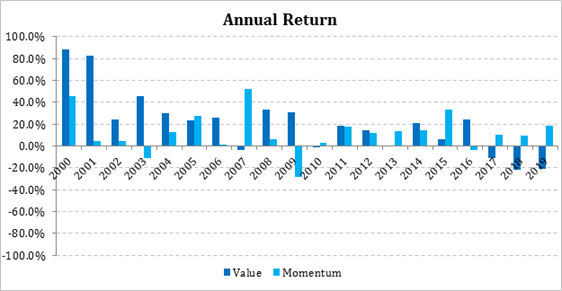
- From the annual returns chart below we can see that our Momentum composite has held up rather well post-Global Financial Crisis except for the 2009 inflection point which did severe damage to the short side of Momentum & the 2016 Citadel Voyager inspired Momentum crowding unwind.
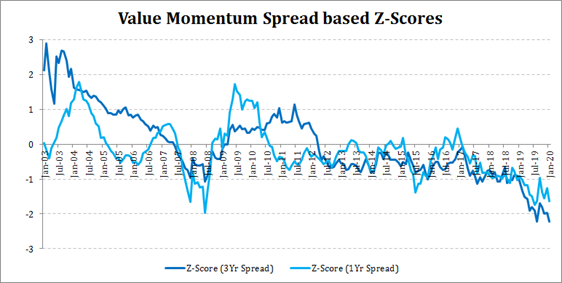
- The underperformance over the last 3 years has resulted in Value factor becoming “cheaper” (meaning the valuation dispersion between its longs vs shorts has become much more extreme) because many of the growthy shorts continue to get bid up (which would also suggest that’s where much of the spread reversal may come from as opposed to the long side). Looking at the z-score of 1-year spread returns [for Value– Momentum] at ~-1.5 in the chart below and the 3-year spread z-score of at
- Key catalyst for Value remains the steepness of the curve for financials & cyclicals to ignite – that remains to be seen as the move clearly fizzled out fast.
- Stay tuned for more on the historically extreme valuation dispersion spread we speak of above – we will be formalizing our “Factor on Factor” research framework which looks at the valuation, momentum etc attributes of factors themselves from a timing standpoint.
For 2019 recaps, see 2019 Composite Signal Monitor Performance Recap – QMIT by QuantZ and 2019 Factor Recap – QMIT by QuantZ.
Disclosure: QMIT – QuantZ Machine Intelligence Technologies
QMIT is a data provider and not an investment advisor. This information has been prepared by QMIT for informational purposes only. This information should not be construed as investment, legal and/or tax advice. Additionally, this content is not intended as an offer to sell or a solicitation of any investment product or service. Opinions expressed are based on statistical forecasting from historical data. Past performance does not guarantee future performance. Further, the assumptions and the historical data based used could be erroneous. All results and analyses expressed are merely hypothetical and are NOT guaranteed. Trading securities involves substantial risk. Please consult a qualified investment advisor before risking any capital. The performance results for live portfolios following the screens presented herein may differ from the performance hypotheticals contained in this report for a variety of reasons, including differences related to transaction costs, market impact, fees, as well as differences in the time and price of execution. The performance results for individuals following the strategy could also differ based on differences in treatment of dividends received, including the amount received and whether and when such dividends were reinvested. We do not request personal information in any unsolicited email correspondence from our customers. Any correspondence offering trading advice or unsolicited message asking for personal details should be treated as fraudulent and reported to QMIT. Neither QMIT nor its third-party content providers shall be liable for any errors, inaccuracies or delays in content, or for any actions taken in reliance thereon. QMIT EXPRESSLY DISCLAIMS ALL WARRANTIES, EXPRESSED OR IMPLIED, AS TO THE ACCURACY OF ANY THE CONTENT PROVIDED, OR AS TO THE FITNESS OF THE INFORMATION FOR ANY PURPOSE. Although QMIT makes reasonable efforts to obtain reliable content from third parties, QMIT does not guarantee the accuracy of or endorse the views or opinions given by any third-party content provider. All content herein is owned by QuantZ Machine Intelligence Technologies and/ or its affiliates and protected by United States and international copyright laws. QMIT content may not be reproduced, transmitted or distributed without the prior written consent of QMIT.
Disclosure: Interactive Brokers
Information posted on IBKR Campus that is provided by third-parties does NOT constitute a recommendation that you should contract for the services of that third party. Third-party participants who contribute to IBKR Campus are independent of Interactive Brokers and Interactive Brokers does not make any representations or warranties concerning the services offered, their past or future performance, or the accuracy of the information provided by the third party. Past performance is no guarantee of future results.
This material is from QMIT – QuantZ Machine Intelligence Technologies and is being posted with its permission. The views expressed in this material are solely those of the author and/or QMIT – QuantZ Machine Intelligence Technologies and Interactive Brokers is not endorsing or recommending any investment or trading discussed in the material. This material is not and should not be construed as an offer to buy or sell any security. It should not be construed as research or investment advice or a recommendation to buy, sell or hold any security or commodity. This material does not and is not intended to take into account the particular financial conditions, investment objectives or requirements of individual customers. Before acting on this material, you should consider whether it is suitable for your particular circumstances and, as necessary, seek professional advice.