


![[Gamma] Scalping Please](https://ibkrcampus.com/wp-content/smush-webp/2024/04/tir-featured-8-700x394.jpg.webp "[Gamma] Scalping Please")


See Part I for instructions on how to get pandas_datareader or yfinance module to retrieve the data, and Part II to learn how to get stock market data for different geographies. In Part III and Part IV, review the tutorial on how to analyse the stock market data for all the stocks which make up the S&P 500. Part V explains how to use Quandl to get stock market data.
Fundamental Data
We have used yfinance to get the fundamental data.
The first step is to set the ticker and then call the appropriate properties to get the right stock market data.
If yfinance is not installed on your computer, then run the below line of code from your Jupyter Notebook to install yfinance.
!pip install yfinanceinstall yfinance.py hosted with ❤ by GitHub# Import yfinance
import yfinance as yf
# Set the ticker as MSFT
msft = yf.Ticker("MSFT")Import yfinance and set the ticker.py hosted with ❤ by GitHubKey Ratios
You can fetch the latest price to book ratio and price to earnings ratio as shown below.
# get price to book
pb = msft.info['priceToBook']
pe = msft.info['regularMarketPrice']/msft.info['epsTrailingTwelveMonths']
print('Price to Book Ratio is: %.2f' % pb)
print('Price to Earnings Ratio is: %.2f' % pe)
Get price to book.py hosted with ❤ by GitHubRevenues
# show revenues
revenue = msft.financials.loc['Total Revenue']
plt.bar(revenue.index, revenue.values)
plt.ylabel("Total Revenues")
plt.show()
Revenue.py hosted with ❤ by GitHub
Earnings Before Interest and Taxes (EBIT)
EBIT = msft.financials.loc['Earnings Before Interest and Taxes']
plt.bar(EBIT.index, EBIT.values)
plt.ylabel("EBIT")
plt.show()
EBIT.py hosted with ❤ by GitHub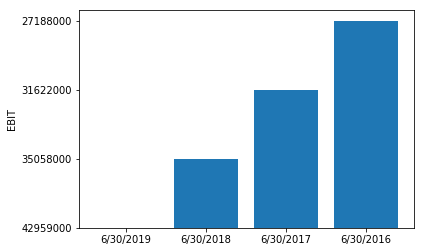
Balance sheet, cash flows and other information
# show income statement
msft.financials
# show balance heet
msft.balance_sheet
# show cashflow
msft.cashflow
# show other info
msft.info
Show information.py hosted with ❤ by GitHubStay tuned for next installment in which Ishan Shah will share a tutorial on Stock Market Data Visualization and Analysis.
See https://blog.quantinsti.com/stock-market-data-analysis-python/ for additional insight on this topic.
Past performance is not indicative of future results.
Any stock, options or futures symbols displayed are for illustrative purposes only and are not intended to portray recommendations.
Disclosure: Interactive Brokers
Information posted on IBKR Campus that is provided by third-parties does NOT constitute a recommendation that you should contract for the services of that third party. Third-party participants who contribute to IBKR Campus are independent of Interactive Brokers and Interactive Brokers does not make any representations or warranties concerning the services offered, their past or future performance, or the accuracy of the information provided by the third party. Past performance is no guarantee of future results.
This material is from QuantInsti and is being posted with its permission. The views expressed in this material are solely those of the author and/or QuantInsti and Interactive Brokers is not endorsing or recommending any investment or trading discussed in the material. This material is not and should not be construed as an offer to buy or sell any security. It should not be construed as research or investment advice or a recommendation to buy, sell or hold any security or commodity. This material does not and is not intended to take into account the particular financial conditions, investment objectives or requirements of individual customers. Before acting on this material, you should consider whether it is suitable for your particular circumstances and, as necessary, seek professional advice.