


![[Gamma] Scalping Please](https://ibkrcampus.com/wp-content/smush-webp/2024/04/tir-featured-8-700x394.jpg.webp "[Gamma] Scalping Please")


For required packages and data preparation scripts see the previous installments in this series here: Part I, Part II, Part III, Part IV, Part V, and Part VI.
We will use mutate to create a new column that holds our label information. I want to display the date, company and symbol on different lines, so will include line breaks with <br>.
ggplotly(
nasdaq_dividends %>%
  filter(symbol != "MACK" & symbol != "FWP") %>%
  left_join(nasdaq_wrangled, by = "symbol") %>%
  group_by(symbol) %>%
  mutate(info = paste(date,
                  '<br>company:', company,
                  '<br>symbol:', symbol,
                  '<br>div: $', dividends)) %>%
  ggplot(aes(x = date,
             y = dividends,
             color = symbol,
             label_tooltip = info)) +
  geom_point() +
  scale_y_continuous(labels = scales::dollar)  +
  scale_x_date(breaks = scales::pretty_breaks(n = 10)) +
  labs(x = "", y = "div/share", title = "Nasdaq dividends") +
  theme(plot.title = element_text(hjust = 0.5)),
tooltip = "label_tooltip"
)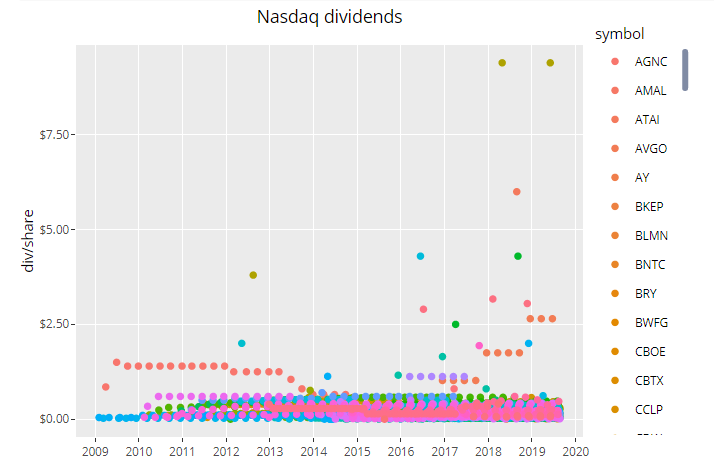
Visit the blog to explore the interactive version of the above chart and download the R code: http://www.reproduciblefinance.com/2019/08/25/tech-dividends/
Note how we can quickly add other information, like the sector, by adding the column sector to the paste string. Indeed, we can paste any column data into that string. There might be a better way to customize the tooltip in plotly – and suggestions most definitely welcome! – but I find this to be a pretty darn good way to add data from our columns.
ggplotly(
nasdaq_dividends %>%
  filter(symbol != "MACK" & symbol != "FWP") %>%
  left_join(nasdaq_wrangled, by = "symbol") %>%
  group_by(symbol) %>%
  mutate(info = paste(date,
                  '<br>company:', company,
                  '<br>sector:', sector,
                  '<br>symbol:', symbol,
                  '<br>div: $', dividends)) %>%
  ggplot(aes(x = date,
             y = dividends,
             color = symbol,
             label_tooltip = info)) +
  geom_point() +
  scale_y_continuous(labels = scales::dollar)  +
  scale_x_date(breaks = scales::pretty_breaks(n = 10)) +
  labs(x = "", y = "div/share", title = "Nasdaq dividends") +
  theme(plot.title = element_text(hjust = 0.5)),
tooltip = "label_tooltip"
)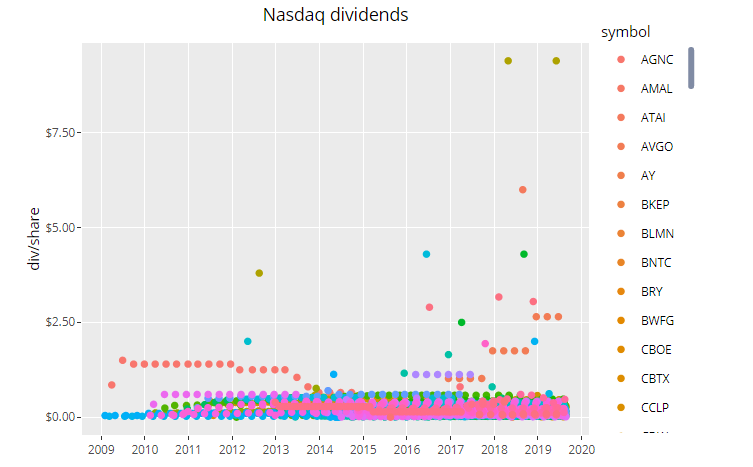
Visit the blog to explore the interactive version of the above chart and download the R code: http://www.reproduciblefinance.com/2019/08/25/tech-dividends/
Any stock, options or futures symbols displayed are for illustrative purposes only and are not intended to portray recommendations.
Disclosure: Interactive Brokers
Information posted on IBKR Campus that is provided by third-parties does NOT constitute a recommendation that you should contract for the services of that third party. Third-party participants who contribute to IBKR Campus are independent of Interactive Brokers and Interactive Brokers does not make any representations or warranties concerning the services offered, their past or future performance, or the accuracy of the information provided by the third party. Past performance is no guarantee of future results.
This material is from Reproducible Finance and is being posted with its permission. The views expressed in this material are solely those of the author and/or Reproducible Finance and Interactive Brokers is not endorsing or recommending any investment or trading discussed in the material. This material is not and should not be construed as an offer to buy or sell any security. It should not be construed as research or investment advice or a recommendation to buy, sell or hold any security or commodity. This material does not and is not intended to take into account the particular financial conditions, investment objectives or requirements of individual customers. Before acting on this material, you should consider whether it is suitable for your particular circumstances and, as necessary, seek professional advice.