


See Part I and Part II in this article for instructions from Matthew Smith on which R packages and data sets you need.
I next calculate the Durbin-Watson statistic. I mostly code using R’s tidy data principles and therefore use the tidy function from the broom package to tidy the output of the DW statistic up a little. I do this for both the synthetic time series and real time series.
# I calculate the Durbin-Watson statistic and use the "tidy()" function to summarise the key info
dw_test_class_zero <- df %>%
dplyr::filter(class == 0) %>%
nest(-row_id) %>%
mutate(dw_res = map(data, ~ broom::tidy(lmtest::dwtest(value ~ 1, data = .x)))) %>%
unnest(dw_res) %>%
mutate(class = “0”)
dw_test_class_zero %>%
head()
## # A tibble: 6 x 7
## row_id data statistic p.value method alternative class
##
## 1 1 [260 x 4] 1.98 0.426 Durbin-Wat~ true autocorrelation ~ 0
## 2 2 [260 x 4] 2.01 0.521 Durbin-Wat~ true autocorrelation ~ 0
## 3 4 [260 x 4] 2.08 0.747 Durbin-Wat~ true autocorrelation ~ 0
## 4 5 [260 x 4] 2.49 1.000 Durbin-Wat~ true autocorrelation ~ 0
## 5 6 [260 x 4] 1.90 0.214 Durbin-Wat~ true autocorrelation ~ 0
## 6 9 [260 x 4] 1.87 0.138 Durbin-Wat~ true autocorrelation ~ 0
# Here I do the exact same thing as above but this time for the class == 1 data.
dw_test_class_one <- df %>%
filter(class == 1) %>%
nest(-row_id) %>%
mutate(dw_res = map(data, ~ broom::tidy(lmtest::dwtest(value ~ 1, data = .x)))) %>%
unnest(dw_res) %>%
mutate(class = “1”)
dw_test_class_one %>%
head()
## # A tibble: 6 x 7
## row_id data statistic p.value method alternative class
##
## 1 3 [260 x 4] 2.08 0.728 Durbin-Wat~ true autocorrelation ~ 1
## 2 7 [260 x 4] 1.81 0.0654 Durbin-Wat~ true autocorrelation ~ 1
## 3 8 [260 x 4] 1.93 0.296 Durbin-Wat~ true autocorrelation ~ 1
## 4 13 [260 x 4] 2.05 0.644 Durbin-Wat~ true autocorrelation ~ 1
## 5 15 [260 x 4] 2.07 0.715 Durbin-Wat~ true autocorrelation ~ 1
## 6 16 [260 x 4] 2.07 0.709 Durbin-Wat~ true autocorrelation ~ 1
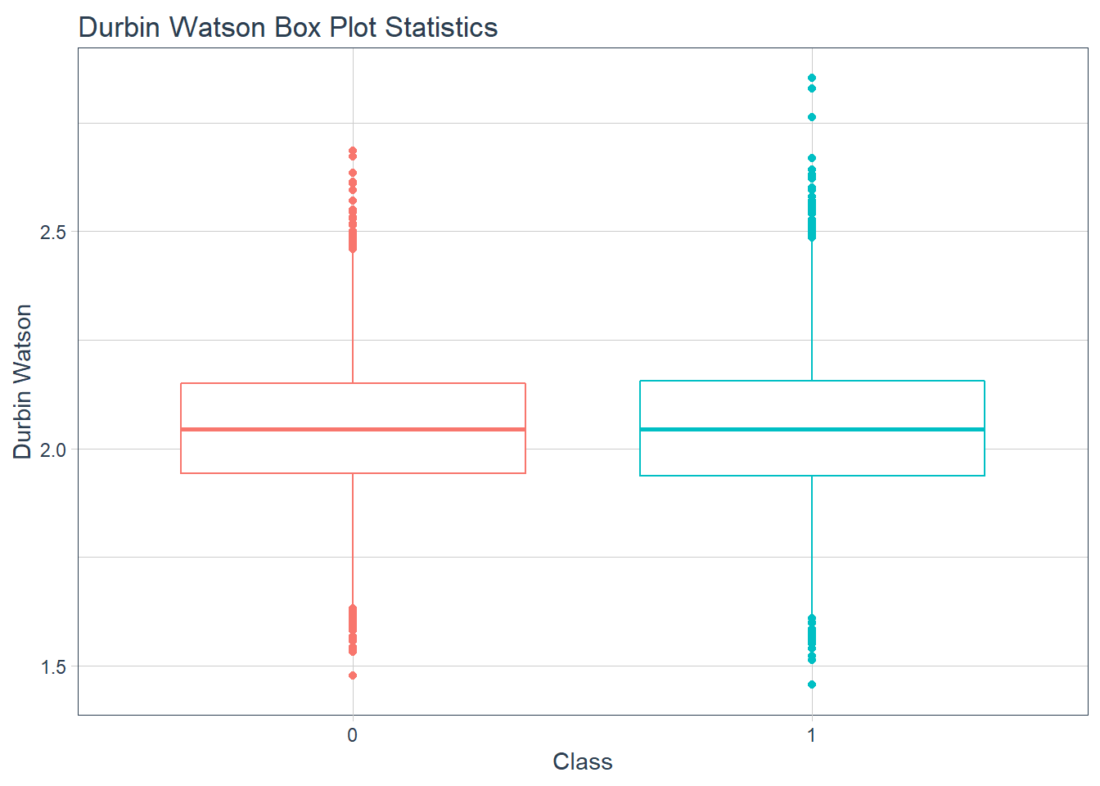
Next I plot the boxplot statistics for each of the Durbin Watson tests.
# I bind the rows together and plot a box-plot.
bind_rows(dw_test_class_zero, dw_test_class_one) %>%
group_by(class) %>%
ggplot(aes(x = factor(class), y = statistic, color = factor(class))) +
geom_boxplot(show.legend = FALSE) +
ggtitle(“Durbin Watson Box Plot Statistics”) +
xlab(“Class”) +
ylab(“Durbin Watson”) +
theme_tq()
Visit Matthew Smith – R Blog to see the next step in his analysis, which is to compute the 10 day rolling mean and standard deviation using the tq_mutate function from the tidyquant package.
Disclosure: Interactive Brokers
Information posted on IBKR Campus that is provided by third-parties does NOT constitute a recommendation that you should contract for the services of that third party. Third-party participants who contribute to IBKR Campus are independent of Interactive Brokers and Interactive Brokers does not make any representations or warranties concerning the services offered, their past or future performance, or the accuracy of the information provided by the third party. Past performance is no guarantee of future results.
This material is from Matthew Smith - R Blog and is being posted with its permission. The views expressed in this material are solely those of the author and/or Matthew Smith - R Blog and Interactive Brokers is not endorsing or recommending any investment or trading discussed in the material. This material is not and should not be construed as an offer to buy or sell any security. It should not be construed as research or investment advice or a recommendation to buy, sell or hold any security or commodity. This material does not and is not intended to take into account the particular financial conditions, investment objectives or requirements of individual customers. Before acting on this material, you should consider whether it is suitable for your particular circumstances and, as necessary, seek professional advice.