


![[Gamma] Scalping Please](https://ibkrcampus.com/wp-content/smush-webp/2024/04/tir-featured-8-700x394.jpg.webp "[Gamma] Scalping Please")


Time series data, simply put, is a set of data points collected at regular time intervals. We encounter time series data every day in our lives – stock prices, real estate market prices, energy usage at our homes and so on. So why should we care about this data? Because understanding time series data, especially of stock prices, is an important skill for quants.
Visualizing time series data plays a key role in identifying certain patterns in graphs. Some properties associated with time series data are trends (upward, downward, stationary), seasonality (repeating trends influenced by seasonal factors), and cyclical (trends with no fixed repetition). Instead of focusing on outlook analyses, we’ll guide you through the first step in time series analysis: Visualization.
How would you go about visualizing time series data? Should you use Microsoft Excel or other programming languages?
Whether you are a newbie or are an experienced programmer, Python is a great language to know since it is very straightforward and easy to pick up. It also has become the language to learn due to its powerful libraries for data analysis, data wrangling, and modeling. One of these libraries is Pandas. Pandas is built directly off of numpy, which is a numerical library that uses arrays, which efficiently store data. Certainly, Excel has been around for more than 30 years (the first Macintosh version was released on September 30, 1985; Windows version was released in late November of 1987) but manipulating data using Pandas is far more efficient and superior.
Within Excel, different datasets are stored across different sheets. The data within each of these sheets are in columns (unique factors or variables collected), rows (unique records), and cells (an individual record for a particular factor). This provides a convenient user interface, where you can click and scroll through across different sheets and different cells.
The downside? Excel crashes when the dataset contains tons of thousands of records upon opening the file, while Pandas does not. In Pandas, the different datasets are imported as .csv or .tsv files and data are in the format of the data frame. You do not have the readily visible sheets or cells to click through, but you can easily get access to the data with one line command.
Now let’s take a look at the real-world application of Pandas.
We’ll now take you through the initial stage of plotting time series data of airline stock prices using Pandas. You can choose any other companies of your interest. And no, you do not need to have any prior programming knowledge to follow along. If you want to code along, I recommend installing the python distribution, either anaconda or canopy, which comes with pre-installed commonly used packages, including Pandas and Matplotlib.
Application – Airline Stock Information
Here, we look at the historical stock information of Delta, Jet Blue, and Southwest Airlines from January 1, 2012, to March 27, 2018. We will use stock data provided by Quandl.
Part 1: Import
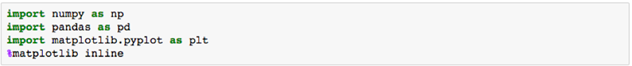
Let’s import the various libraries we will need. We will be using Matplotlib, which is a plotting library for Python, for visualizing our data points.
In the next installment of this series, Khaing will show you how to manipulate the data and use Python to plot the visualisation.
Written by Khaing Win, Ph.D. in Neuroscience, for Byte Academy Blog.
Disclosure: Interactive Brokers
Information posted on IBKR Campus that is provided by third-parties does NOT constitute a recommendation that you should contract for the services of that third party. Third-party participants who contribute to IBKR Campus are independent of Interactive Brokers and Interactive Brokers does not make any representations or warranties concerning the services offered, their past or future performance, or the accuracy of the information provided by the third party. Past performance is no guarantee of future results.
This material is from Byte Academy and is being posted with its permission. The views expressed in this material are solely those of the author and/or Byte Academy and Interactive Brokers is not endorsing or recommending any investment or trading discussed in the material. This material is not and should not be construed as an offer to buy or sell any security. It should not be construed as research or investment advice or a recommendation to buy, sell or hold any security or commodity. This material does not and is not intended to take into account the particular financial conditions, investment objectives or requirements of individual customers. Before acting on this material, you should consider whether it is suitable for your particular circumstances and, as necessary, seek professional advice.
Disclosure: Displaying Symbols on Video
Any stock, options or futures symbols displayed are for illustrative purposes only and are not intended to portray recommendations.
Disclosure: Futures Trading
Futures are not suitable for all investors. The amount you may lose may be greater than your initial investment. Before trading futures, please read the CFTC Risk Disclosure. A copy and additional information are available at ibkr.com.