


![[Gamma] Scalping Please](https://ibkrcampus.com/wp-content/smush-webp/2024/04/tir-featured-8-700x394.jpg.webp "[Gamma] Scalping Please")


The post “Who Needs Dividends and Interest?” first appeared on Light Finance Blog.
In another world, seemingly long ago (i.e., January of 1990) the yield on the 10-Year Treasury was 8.20% while the dividend yield on the S&P 500 – which varies with market valuations – stood at 3.28%. In this world, a retiree with a $1,000,000 nest egg could have invested their portfolio is 10-Year Treasury bonds – a technically risk-free asset – and lived comfortably off interest income of $82,000 per year. An investor more comfortable with risk choosing to invest in stocks could have expected income of $32,800 per year, but would principally have relied on capital appreciation to meet their retirement goals; which necessarily involves more risk.
As the above illustration highlights, cash flow from low risk investments was previously sufficient to meet investors’ lifestyles. Increasingly, however, investors have had to rely on price appreciation to finance their needs. As of June 2021 the 10-Year Treasury yield was 1.52% while the S&P 500 dividend yield was 1.37%. As the below plot demonstrates, it is increasingly common for the S&P 500 dividend yield to exceed treasuries. Interest and dividends at such miserly levels is unlikely to address investor’s income needs. This has left many wondering how they can increase cash flow or what other options are available to them.

In this post, we’ll examine the issue of investor cash flow and whether it’s the appropriate paradigm for assessing your investments.
Income or Cash Flow?
There is a conceptual difference between income from a portfolio and cash flow. Income refers to cash payments received from the portfolio (i.e., interest and dividends). Cash flow refers to the capacity of your portfolio to provide you with a consistent paycheck which may be derived partially from interest or dividends, but may also come from the principal.
Understanding this distinction is subtle, but important. As an investor, it’s generally more appropriate to focus on the total return of a portfolio and the sustainable withdrawal rate rather than the myopic view of yield.
Understanding Interest and Dividends
Dividends from Stock
A common misunderstanding that I encounter with respect to dividends is that investor’s often view them as “free money”. Investing in dividend stocks won’t necessarily create excess shareholder wealth over time as a stock’s price usually declines on the day that it begins to trade ex-dividend (i.e. without its dividend). The reason for this is intuitive: a company has a certain amount of cash on its balance sheet which is reflected in the value of its equity, once that cash is paid out the equity necessarily has to decline to offset the change in assets. The below chart depicts this visually. It’s important that your dividend strategy be analyzed from a total return perspective accounting for both income and capital appreciation.

Interest from Bonds
You encounter a similar issue with bonds. While bonds generally tend to be lower risk than stocks, in many ways they are also more complex and investors generally have less direct experience with them.
In order to understand bonds properly, I’m going to have to introduce a little jargon:
- Par-Value: Also called face-value is the value of the bond at maturity. This is the value of the final payment that a bond holder will receive and serves as the basis for calculating certain bond characteristics.
- Term: Refers to the length of time the bond will make payments. The bond reaches maturity when the term expires.
- Coupon: The coupon is the periodic payment that the bond promises to make and is typically quoted as a rate. Coupon payments are usually made on a semi-annual or annual basis.
- Yield to Maturity (YTM): Yield to Maturity is difficult concept when you are first trying to understand it. The yield to maturity (expressed as a rate) represents the return an investor would expect to receive from a bond if they bought it today at prevailing market rates and reinvested the interest payments at the today’s prevailing rate.
- Discount/Premium: A Discount/Premium refers to a bond that is trading below/above it’s par value. A bond will generally trade at a discount when it’s coupon rate is less than the YTM. This makes sense as the periodic payment you receive from the coupon is less than the market rate hence you are not willing to pay as much for the bond. Similarly with bonds that trade at a premium, the coupon rate is greater than the market rate. Thus to get the higher periodic payment you’re going to have to pay more up front.
Confused yet? Let’s try and make these concepts more concrete with an few examples.
Example 1: Bond Trading at a Premium
Consider a bond with the following characteristics:
- Term: 10 year
- Coupon: 4% paid annually
- Par Value: $1000
Suppose the prevailing market interest rate is 2%. We can use this information to calculate the price of the bond using Excel as follows:
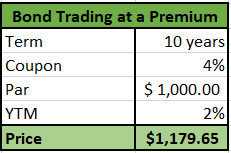
The coupon rate for this bond is greater than the yield to maturity, hence the bond trades at a premium to its par value.
Example 2: Bond Trading at a Discount
Consider a bond with the same basic characteristics, but now suppose the prevailing market interest rate is 6%. What’s the bond’s price given these conditions?
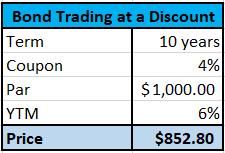
The bond’s 4% coupon is less than the YTM, hence the bond trades at a discount to its par value.
So what is the point of the above discussion? The intention is to highlight that when investing in bonds, it’s important to consider more than just income. The bond will pay out the coupon rate on a regular, defined schedule, but there is significantly more to the story.
Consider the bond trading at the premium (Example 1). If you purchased this bond, then you could expect to receive $40 annually in income. Certainly you could spend the entire $40, but remember that for the privilege you paid $1179.65 up front and at maturity you will only get back $1,000 in par value. Take a moment to consider what this means: you paid $1,179.65 for the bond, you spend the $40 annual coupon payment, you get $1,000 back at maturity. This means that now you only have $1,000 left with which to purchase a new bond. The $179.65 in premium you paid is gone. Because the coupon was greater than the YTM, the premium you initially paid went toward financing the higher payout. You are effectively spending a little principle when you spend the full coupon.
As the below table illustrates, if your objective is to preserve your capital, then you can only spend ~$22.03 of each coupon payment. The other $17.97 needs to be saved. Otherwise you run the risk of eroding your capital over time!

Reaching for Yield or Reaching for Risk?
Trying to satisfy income needs exclusively with interest and dividends in the face of declining yields across equity and fixed income has induced investors to move out on the risk curve. The following two charts show the results. The first graph plots the yield for different sectors of the fixed income market. In particular notice that yields across sectors and ratings are either at or near all time lows.
Visit Light Finance to view the interactive chart.
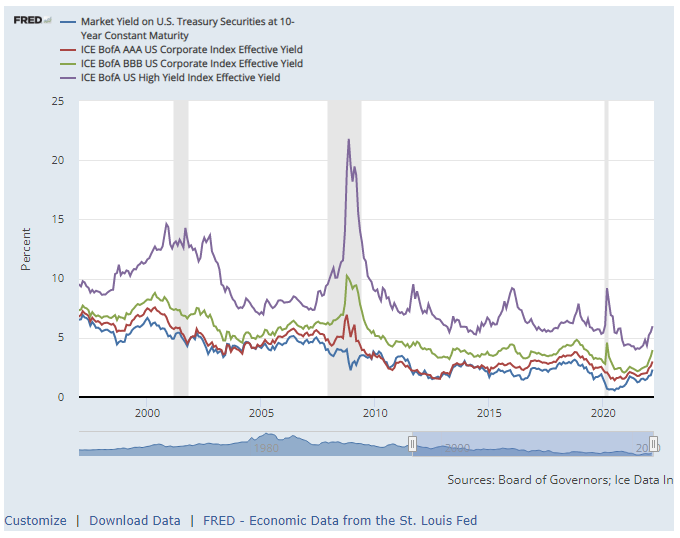
Customize | Download Data | FRED – Economic Data from the St. Louis Fed
Another way to view the yield compression of recent years is to look at the spread to Treasuries. The picture is perhaps somewhat better as yield spreads are not markedly different from what we have observed over the past two decades, but at the same time suggests that there is limited upside to be gained from investing in these sectors.
Visit Light Finance to view the interactive chart.
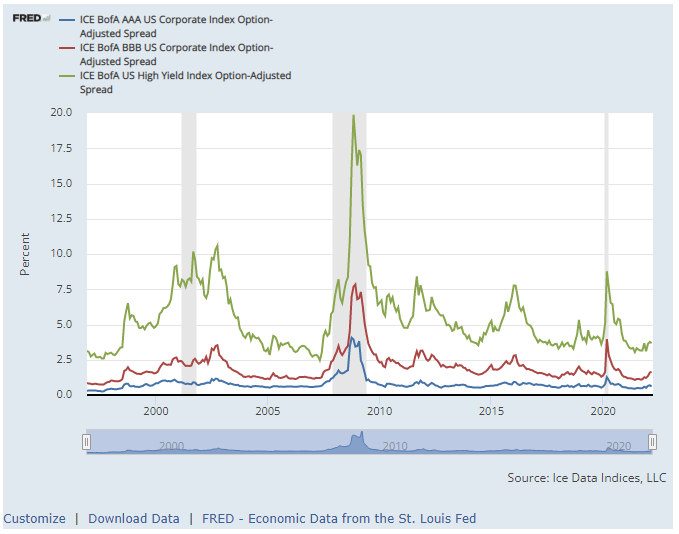
Customize | Download Data | FRED – Economic Data from the St. Louis Fed
It’s not just an issue that absolute yields are lower. Reaching for yield can inadvertently lead to a suboptimal portfolio allocation and lower risk adjusted returns. Investors may not realize that they have drifted from their long term allocation which can have the effect of compromising long-term goals for marginally higher current income.
Mental Accounting or Sustainable Withdrawal Rate?
Most investors seem to be more comfortable with the idea of harvesting cash from interest and dividends as they think of those payments—the income—as separate from the investment holdings that generate them—the principal. Assigning different values or preferences, based on subjective criteria, to the same amount of money without considering how it translates to achieving a goal or objective is a bias known as Mental Accounting.
Nobel Laureate Richard Thaler developed the concept of mental accounting to describe phenomena involving irrational decision making and investment behavior. At its core, the theory postulates that all money is fungible. That is to say, regardless of origin, all money is the same. While this may seem intuitive on its face, our mental bias fosters a sense that the earning power of the investments remains unchanged when we take income from our portfolio. The reality is that every dollar withdrawn from a portfolio reduces earning power to exactly the same extent. The source of the withdrawals does not usually matter. Whether a portfolio can sustain any particular withdrawal level depends on the long-term, total return expectation and not whether that return is derived primarily from interest, dividends or capital appreciation.
Do You Need Interest and Dividends?
Short answer: it depends. Interest and dividends are only one component of total return and while they provide some clues as to the viability of an investment they do not tell the full story. The correct framework for evaluating an investment is to consider the total return, the attendant risk and how both fit together within the context your financial goals.
Hopefully this post has provided you with a new way to look at the cash flow from your portfolio.
Until next time, thanks for reading!
Disclosure: Interactive Brokers
Information posted on IBKR Campus that is provided by third-parties does NOT constitute a recommendation that you should contract for the services of that third party. Third-party participants who contribute to IBKR Campus are independent of Interactive Brokers and Interactive Brokers does not make any representations or warranties concerning the services offered, their past or future performance, or the accuracy of the information provided by the third party. Past performance is no guarantee of future results.
This material is from Light Finance and is being posted with its permission. The views expressed in this material are solely those of the author and/or Light Finance and Interactive Brokers is not endorsing or recommending any investment or trading discussed in the material. This material is not and should not be construed as an offer to buy or sell any security. It should not be construed as research or investment advice or a recommendation to buy, sell or hold any security or commodity. This material does not and is not intended to take into account the particular financial conditions, investment objectives or requirements of individual customers. Before acting on this material, you should consider whether it is suitable for your particular circumstances and, as necessary, seek professional advice.