


![[Gamma] Scalping Please](https://ibkrcampus.com/wp-content/smush-webp/2024/04/tir-featured-8-700x394.jpg.webp "[Gamma] Scalping Please")


CMT Association’s Market Insights features timely technical analysis of current global markets by veteran CMT charterholders. Each post appears on www.tradingview.com/u/CMT_Association/ in an effort to explain process, tools, and the responsible practice of technical analysis. Shared content and posted charts are intended to be used for informational and educational purposes only. The CMT Association does not offer, and this information shall not be understood or construed as, financial advice or investment recommendations. The information provided is not a substitute for advice from an investment professional. The CMT Association does not accept liability for any financial loss or damage our audience may incur.
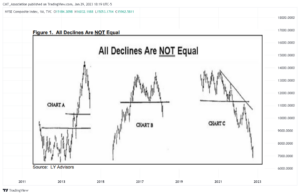
It is pertinent to remember that there are always stocks to sell into rising markets and stocks to buy into falling markets. Even in a general market correction it is important to distinguish that all declines are not equal under the surface. By that we mean that while prices may all head in a southern direction, what is important is the point from which that decline began in the more structural price pattern of each individual stock.
In other words, we seek to identify what the individual price patterns technically signify in the supply and demand factors underlying the decline. In the past, we have characterized declines in three distinct patterns (Fig 1).
Figure 1:

Chart Pattern A (Figure 2) for educational examples): Declines that may occur within the framework of a structural uptrend in a stock. This pattern would imply that the stock had emerged from a base, or from a secondary consolidation within an uptrend and has declined, or may decline, back toward (or into) that congestion area that now represents support (or an area of demand) for the stock; or pull back within an extended uptrend to create a new area of congestion representing support.
We would not expect stocks representative of this pattern technically to fall to new lows (although in any volatile environment, support levels can be temporarily breached). On balance, we would perceive these Chart A patterns to be among the market leaders, which could be bought into weakness with the longer-term trend in mind.
Notice price uptrends, breakouts through multi-year resistance levels; perhaps a secondary resistance level and the Monthly MACDs on Buy signals (rising).
Figure 2: Examples of Chart A: As an Educational Exercise FLEX, JBL , GFF , Monthly:

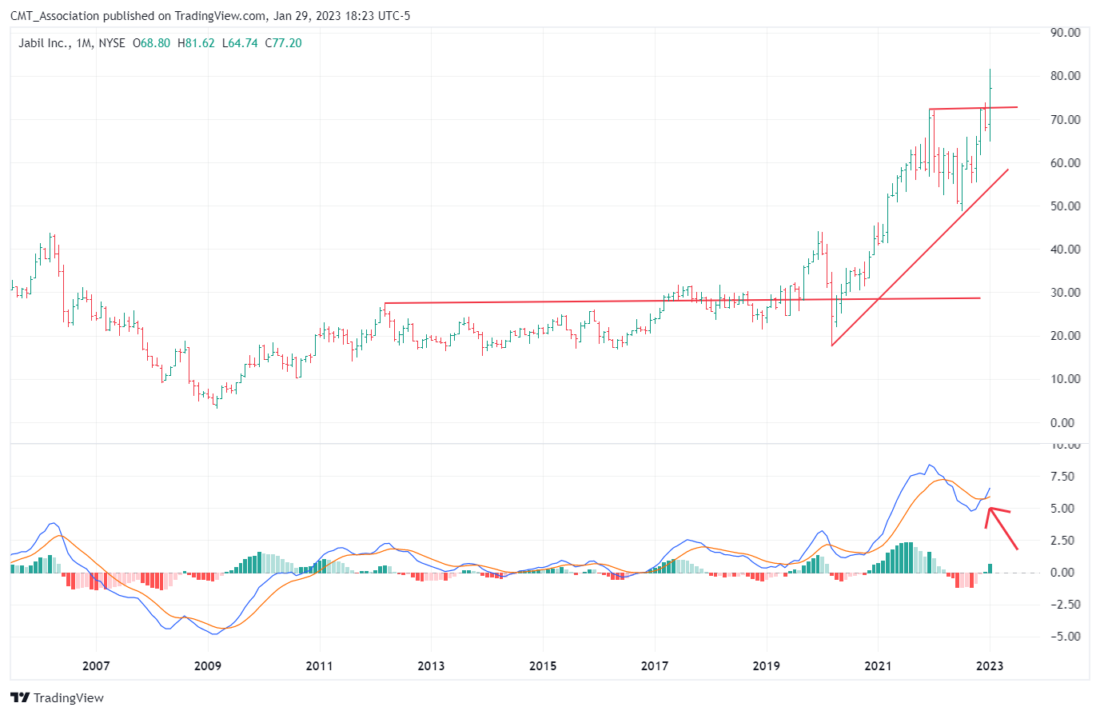
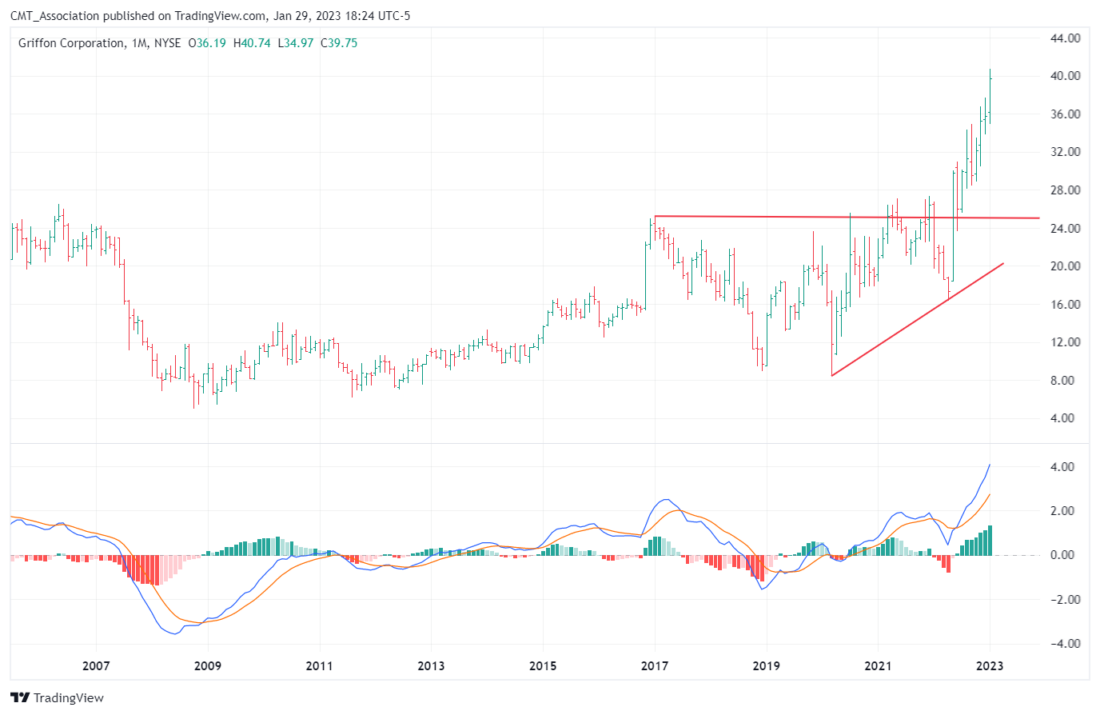
Chart Pattern B (see Figure 3 for educational examples): Initial declines, which break below an established support level following an extended uptrend, frequently defining a “topping“ pattern (see arcs) and initiating a structural downtrend for the stock. The Monthly MACD has moved into a declining Sell signal (see red arrows) often with a negative divergence. Patterns of this type can be expected to fall to new lows, often following a kickback rally toward the broken support, now defined as resistance (offering an opportunity to sell into strength), and to underperform the market during weakness (go down more).
This is the pattern to watch for with stocks and / or groups, to guard against a reversal of trend from positive to negative (from a trend of demand to one of supply). Some names that had continued to lift in uptrends during the initial markets’ decline through 2022 are now appearing vulnerable (see Figure 3 below).
Figure 3. Examples of Chart B; As an Educational Exercise UNH , LHX , Monthly

Chart Pattern C (see Figure 4 for educational examples): Secondary declines, generally occur in stocks that have experienced initial structural declines (Pattern B) in the recent past, and thereafter may have bounced into resistance (formerly support) where they encountered supply (selling) and have thereafter fallen back, sometimes establishing a trading range that is eventually penetrated once again to the downside, accompanied by a declining MACD , on a Sell signal; thus extending the structural decline already in place. New lows in price are generally established for the stock.
Such stocks experience their own private corrections and bear markets, sometimes even under the surface of a rallying equity market, as well as into an overall declining market. By virtue of observing the differing characteristics of individual stock declines, one can utilize rallies to sell weaker names, but also utilize dips to accumulate stronger names, as evidenced by which of the three chart patterns a stock portrays. However, in a general market decline, whatever the pattern, one might still consider overall protective measures.
Figure 4. Examples of Chart C: As an Educational Exercise AMZN , PYPL , Monthly.

—
Originally Posted January 29, 2023 – All Declines Are Not Equal
Disclosure: CMT Association
Shared content and posted charts are intended to be used for informational and educational purposes only. The CMT Association does not offer, and this information shall not be understood or construed as, financial advice or investment recommendations. The information provided is not a substitute for advice from an investment professional. The CMT Association does not accept liability for any financial loss or damage our audience may incur.
Disclosure: Interactive Brokers
Information posted on IBKR Campus that is provided by third-parties does NOT constitute a recommendation that you should contract for the services of that third party. Third-party participants who contribute to IBKR Campus are independent of Interactive Brokers and Interactive Brokers does not make any representations or warranties concerning the services offered, their past or future performance, or the accuracy of the information provided by the third party. Past performance is no guarantee of future results.
This material is from CMT Association and is being posted with its permission. The views expressed in this material are solely those of the author and/or CMT Association and Interactive Brokers is not endorsing or recommending any investment or trading discussed in the material. This material is not and should not be construed as an offer to buy or sell any security. It should not be construed as research or investment advice or a recommendation to buy, sell or hold any security or commodity. This material does not and is not intended to take into account the particular financial conditions, investment objectives or requirements of individual customers. Before acting on this material, you should consider whether it is suitable for your particular circumstances and, as necessary, seek professional advice.
