


CMT Association’s Market Insights features timely technical analysis of current global markets by veteran CMT charterholders. Each post appears on www.tradingview.com/u/CMT_Association/ in an effort to explain process, tools, and the responsible practice of technical analysis. Shared content and posted charts are intended to be used for informational and educational purposes only. The CMT Association does not offer, and this information shall not be understood or construed as, financial advice or investment recommendations. The information provided is not a substitute for advice from an investment professional. The CMT Association does not accept liability for any financial loss or damage our audience may incur.
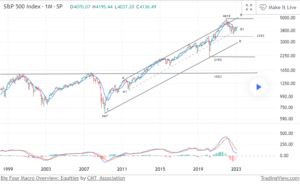
SPX Monthly Log Scale:
- Despite last years 28% decline, the defining uptrends remain intact. In my view, the A1-B1 trendline best defines the bull market but decent arguments can also be made for C-D. A test of C-D would require that the market decline roughly 30% from the most recent close.
- In the absence of overtly bearish behaviors and with the primary trendlines intact, I would be hard pressed to conclude that the macro trend has changed. The secular bull remains intact and it should be given the benefit of the doubt.
- That said, my fundamental world view continues to suggest that equity remains vulnerable. I believe that the primary trend is in a transition between bull and bear (or at least bull to neutral).
- While still willing to take bullish trades, I will monitor closely for opportunities to sell solid technical setups into weekly perspective strength.
- Generally speaking, this position in the trend continues to be characterized by poor valuations and overly developed bullish sentiment. That was certainly true going into last year, but has been somewhat addressed (depending upon the sector). Despite last years decline, I see valuations and sentiment as more consistent with a market building a top as opposed to one basing for a fresh bull run.
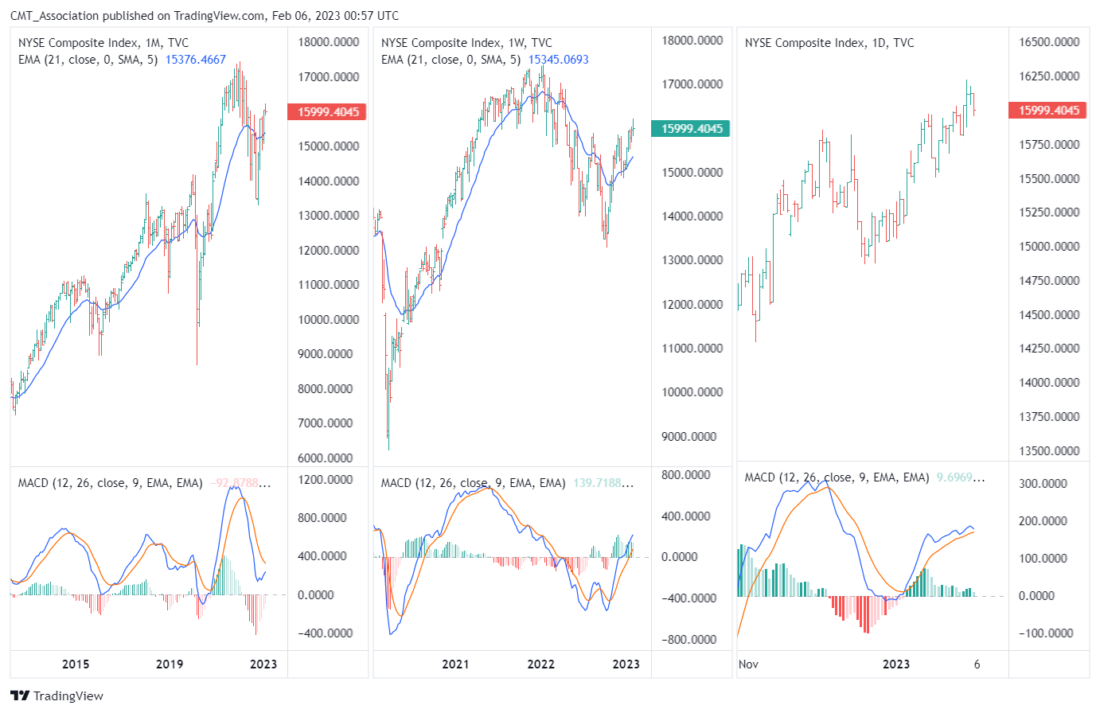
Triple Screen ( MACD Momentum):
- Suggests that the current weekly perspective rally is corrective to last years monthly decline. The daily (far right) is setting up a significant divergence, suggesting that the current daily perspective uptrend is quickly aging.

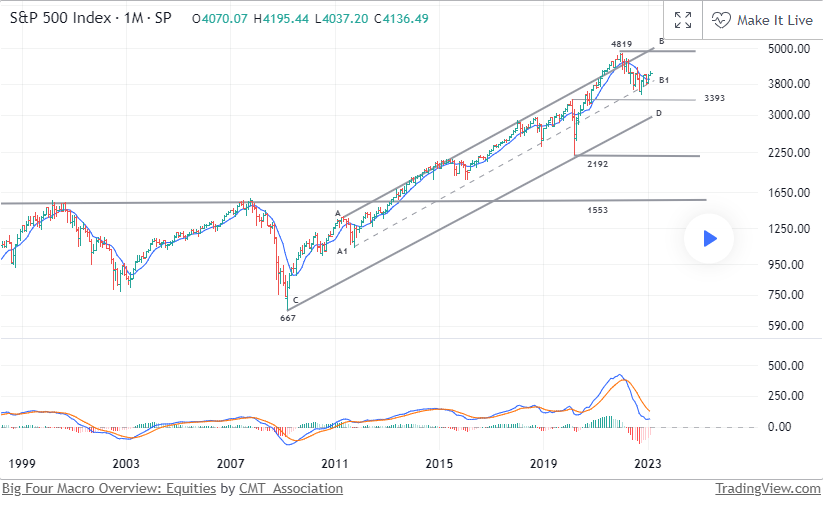
NYSE Composite Monthly (Log):
- Despite last years decline, the technical trend remains intact.
- Last years high to low decline covered 25%. Post “Greenspan Put” declines have covered -42%, -60% and -40% respectively. The 25% drawdown seems incomplete to me. Particularly against an environment in which the Fed is deemphasizing asset prices and concentrating on keeping inflaiton inbounds.
Fundamentally:
- Both policy vectors (Fiscal and Monetary) are negative and are unlikely to provide support. This may change if rising rates break the weakest financial link and forces the Fed to pivot to address a systemic issue or the building recession threatens to become a hard landing.
- Of the 19 bear markets since 1929, 15 have been accompanied by rising inflation . Rising inflation is by far the most consistent/reliable of the bear market factors.
- I believe that the period of very low inflation created by globalization, good demographics, and several other factors has reversed. With higher underlying inflation rates, central banks won’t have the luxury of combating weak asset prices with unlimited liquidity.
And finally, many of the topics and techniques discussed in this post are part of the CMT Associations Chartered Market Technician’s curriculum.
—
Originally Posted February 6, 2023 – Big Four Macro Overview: Equities
Disclosure: CMT Association
Shared content and posted charts are intended to be used for informational and educational purposes only. The CMT Association does not offer, and this information shall not be understood or construed as, financial advice or investment recommendations. The information provided is not a substitute for advice from an investment professional. The CMT Association does not accept liability for any financial loss or damage our audience may incur.
Disclosure: Interactive Brokers
Information posted on IBKR Campus that is provided by third-parties does NOT constitute a recommendation that you should contract for the services of that third party. Third-party participants who contribute to IBKR Campus are independent of Interactive Brokers and Interactive Brokers does not make any representations or warranties concerning the services offered, their past or future performance, or the accuracy of the information provided by the third party. Past performance is no guarantee of future results.
This material is from CMT Association and is being posted with its permission. The views expressed in this material are solely those of the author and/or CMT Association and Interactive Brokers is not endorsing or recommending any investment or trading discussed in the material. This material is not and should not be construed as an offer to buy or sell any security. It should not be construed as research or investment advice or a recommendation to buy, sell or hold any security or commodity. This material does not and is not intended to take into account the particular financial conditions, investment objectives or requirements of individual customers. Before acting on this material, you should consider whether it is suitable for your particular circumstances and, as necessary, seek professional advice.
