


![[Gamma] Scalping Please](https://ibkrcampus.com/wp-content/smush-webp/2024/04/tir-featured-8-700x394.jpg.webp "[Gamma] Scalping Please")


By J.C. Parets & All Star Charts
Wednesday, 10th January, 2023
1/ Bullish Coil in Caterpillar
2/ Brokers Break Out
3/ Improving Internals Around the World
4/ Industrials Buck the Trend
Investopedia is partnering with All Star Charts on this newsletter, which both sells its research to investors, and may trade or hold positions in securities mentioned herein. The contents of this newsletter are for informational and educational purposes only, however, and do not constitute investing advice.
1/ Bullish Coil in Caterpillar
The stock market began the year showing strength in the same areas as it ended last year.
This is particularly true when evaluating the industrial bellwether Caterpillar (CAT), as the stock closed at new all-time highs today.

Not only is CAT making new all-time highs on an absolute basis, but the stock is making fresh multi-year highs relative to the S&P 500. This kind of relative strength is solid confirming evidence for the recent price action.
The next datapoint we’re looking to for confirmation is to see momentum achieve overbought conditions. If and when that happens, it could confirm a valid upside resolution for CAT. This would be a very bullish development for the broader market and risk assets at large.
2/ Brokers Break Out
When it comes to the financial sector, broker-dealers continue to show leadership and are making new highs on a relative basis.
The chart below shows the iShares U.S. Broker-Dealers & Securities Exchanges ETF (IAI) versus the S&P 500 (SPY) resolving higher and completing a structural rounding bottom reversal.

If this base breakout proves to be a valid one, we could expect further outperformance and relative strength from these stocks in the months and quarters ahead.
3/ Improving Internals Around the World
International stocks have had a solid run off their lows from last fall. Not only are they trending well on absolute terms, they have also consistently outperformed their peers in the U.S. since November.
One of the ways we like to measure market internals for the world equity market is by analyzing how many country indexes are above key moving averages.

As shown in the lower pane, more international markets are above their long-term moving average today than at any time in the past year. The current reading is the highest since November of 2021.
Also notice how the percentage of world markets above their intermediate-term, or 50-day moving average, spiked to multi-year highs recently. These are the kinds of breadth thrusts we tend to see in the early stages of new bull markets. As such, the worst could be behind us for international equities.
4/ Industrials Buck the Trend
Some stocks tend to perform better during certain seasons, and others tend to perform worse. We can analyze seasonal trends in various sectors by averaging their monthly returns throughout history.
Below is the average monthly performance of the Large Cap Industrial Sector SPDR (XLI) since the fund’s inception almost 25 years ago.
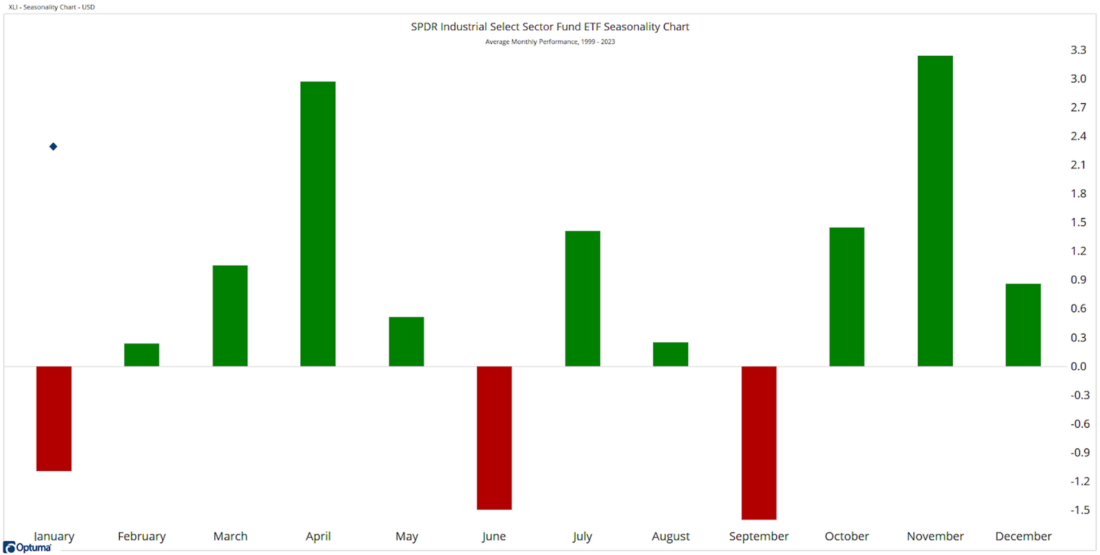
As you can see, January is typically one of the worst months for this industry group, as only June and September have lower average returns. Interestingly, industrials are not following their seasonal trend this year. They are trending higher and outperforming the broader market through the first few trading days of 2023.
Some of the best information from seasonality arrives when stocks ignore their seasonal trend. In other words, if industrials were having a rough start to the year, it would be expected and would not provide much of a signal.
However, the fact that these stocks are rallying despite seasonal headwinds tells us much more. It suggests there is strong demand for this group. If industrials can move higher during their worst months, they could perform even better during seasonally favorable months.
—
Originally posted 10th January 2023
Disclosure: Investopedia
Investopedia.com: The comments, opinions and analyses expressed herein are for informational purposes only and should not be considered individual investment advice or recommendations to invest in any security or to adopt any investment strategy. While we believe the information provided herein is reliable, we do not warrant its accuracy or completeness. The views and strategies described on our content may not be suitable for all investors. Because market and economic conditions are subject to rapid change, all comments, opinions and analyses contained within our content are rendered as of the date of the posting and may change without notice. The material is not intended as a complete analysis of every material fact regarding any country, region, market, industry, investment or strategy. This information is intended for US residents only.
Disclosure: Interactive Brokers
Information posted on IBKR Campus that is provided by third-parties does NOT constitute a recommendation that you should contract for the services of that third party. Third-party participants who contribute to IBKR Campus are independent of Interactive Brokers and Interactive Brokers does not make any representations or warranties concerning the services offered, their past or future performance, or the accuracy of the information provided by the third party. Past performance is no guarantee of future results.
This material is from Investopedia and is being posted with its permission. The views expressed in this material are solely those of the author and/or Investopedia and Interactive Brokers is not endorsing or recommending any investment or trading discussed in the material. This material is not and should not be construed as an offer to buy or sell any security. It should not be construed as research or investment advice or a recommendation to buy, sell or hold any security or commodity. This material does not and is not intended to take into account the particular financial conditions, investment objectives or requirements of individual customers. Before acting on this material, you should consider whether it is suitable for your particular circumstances and, as necessary, seek professional advice.
Disclosure: ETFs
Any discussion or mention of an ETF is not to be construed as recommendation, promotion or solicitation. All investors should review and consider associated investment risks, charges and expenses of the investment company or fund prior to investing. Before acting on this material, you should consider whether it is suitable for your particular circumstances and, as necessary, seek professional advice.
Disclosure: Forex
There is a substantial risk of loss in foreign exchange trading. The settlement date of foreign exchange trades can vary due to time zone differences and bank holidays. When trading across foreign exchange markets, this may necessitate borrowing funds to settle foreign exchange trades. The interest rate on borrowed funds must be considered when computing the cost of trades across multiple markets.


