


By J.C. Parets & All Star Charts
Wednesday, 25th January, 2023
1/ S&P 500 Challenges Resistance
2/ Record Highs for Argentina
3/ An Unwavering Demand for Gold
4/ The Kiwi Readies for Flight?
Investopedia is partnering with All Star Charts on this newsletter, which both sells its research to investors, and may trade or hold positions in securities mentioned herein. The contents of this newsletter are for informational and educational purposes only, however, and do not constitute investing advice.
1/ S&P 500 Challenges Resistance
The S&P 500 (SPY) started the year on strong footing, but more recently price is halting at a logical level of overhead supply.
As you can see, the 200-day moving average (MA), the anchored VWAP from all-time highs, and a downward-sloping trendline are all converging in the same area, setting up a powerful confluence of resistance.

As long as we’re below this critical level, the trend could remain lower at the index level.
However, if and when buyers absorb all the overhead supply and reclaim this level, it could confirm the recent rally and lead to sustained moves higher.
Despite the overwhelming supply for the S&P 500, we operate in a “market of stocks” rather than a “stock market,” with prospects varying among different industry groups and sectors.
2/ Record Highs for Argentina
While the major U.S. averages are stuck below logical levels of supply, international equities are becoming increasingly attractive.
One country fund that stands out is the iShares MSCI Argentina ETF (ARGT) as it breaks out of a five-year base to reach new all-time highs.

We’re seeing more and more countries trending to the upside and making higher highs. This is one more piece of evidence suggesting global equities have taken the lead over U.S. stocks.
The idea of international relative strength might seem foreign to the average U.S. investor, particularly after a decade of outperformance from U.S. equities, but evidence continues to suggest the trend has shifted in favor of ex-U.S. stocks.
3/ An Unwavering Demand for Gold
Buyers are absorbing overhead supply in gold futures. For the past two weeks, precious metals bulls have chipped away at a multi-year resistance level, coinciding with the 2011 peak at approximately $1,924.
This is a critical level for gold as it marks the peak of the last commodity supercycle. The relentless bid at this key resistance level is impressive, especially considering the waning risk appetite across the space.
Here is an overlay chart of gold futures graphed alongside the silver/gold ratio:
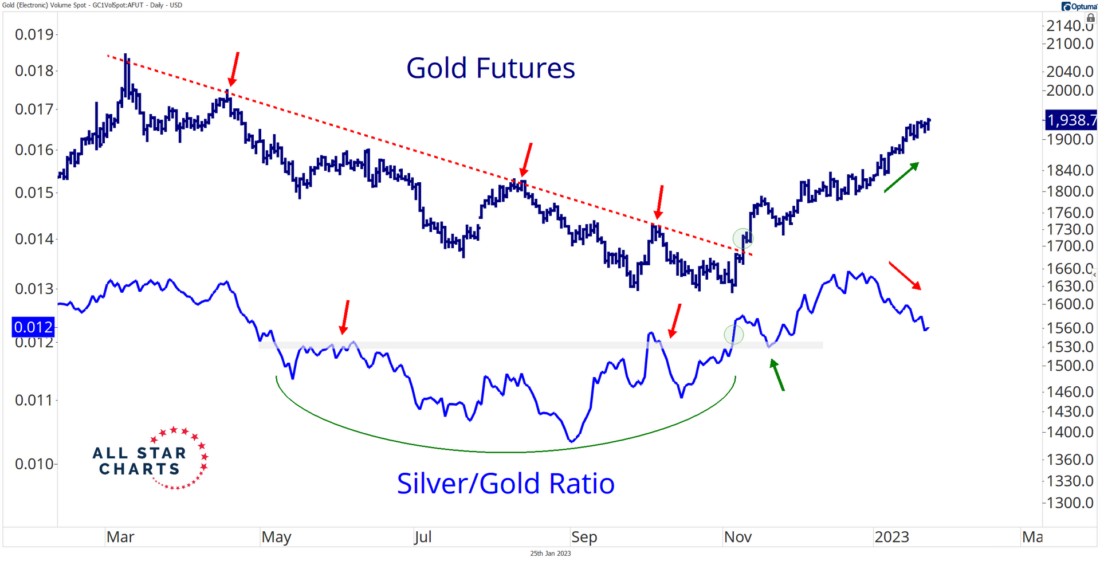
The silver/gold ratio depicts risk appetite for precious metals, as silver represents the higher-beta play and the riskier investment. When the line is rising, investors are reaching for risk, and vice versa.
Seeing gold continue to digest supply while the silver/gold ratio turns lower speaks to meaningful demand for the shiny yellow rock.
If gold refuses to roll over while investors reduce risk, imagine what it could do when risk-on sentiment returns to the market.
4/ The Kiwi Readies for Flight?
Earlier in the week, we highlighted the pound (GBP) as it prepares to stage a breakout against the U.S. dollar. But it’s not the only currency pair that appears poised for an advance, as USD weakness persists.
The chart below depicts the New Zealand dollar and its corresponding currency pair, NZD/USD, carving out a bottoming formation similar to that of GBP/USD:

Notice the kiwi holding within a bullish momentum regime after the 14-day RSI briefly exceeded 70 in early December. This is a bullish development, as momentum has a tendency to lead prices.
Also, the abbreviated right shoulder indicates healthy demand as the bulls place a bid on the market.
The bottom line is that the U.S. Dollar Index (DXY) continues to slide lower. As long as that remains the case, we could witness further strength from other global currencies and risk assets such as international stocks and commodities.
—
Originally posted 25th January, 2022
Disclosure: Investopedia
Investopedia.com: The comments, opinions and analyses expressed herein are for informational purposes only and should not be considered individual investment advice or recommendations to invest in any security or to adopt any investment strategy. While we believe the information provided herein is reliable, we do not warrant its accuracy or completeness. The views and strategies described on our content may not be suitable for all investors. Because market and economic conditions are subject to rapid change, all comments, opinions and analyses contained within our content are rendered as of the date of the posting and may change without notice. The material is not intended as a complete analysis of every material fact regarding any country, region, market, industry, investment or strategy. This information is intended for US residents only.
Disclosure: Interactive Brokers
Information posted on IBKR Campus that is provided by third-parties does NOT constitute a recommendation that you should contract for the services of that third party. Third-party participants who contribute to IBKR Campus are independent of Interactive Brokers and Interactive Brokers does not make any representations or warranties concerning the services offered, their past or future performance, or the accuracy of the information provided by the third party. Past performance is no guarantee of future results.
This material is from Investopedia and is being posted with its permission. The views expressed in this material are solely those of the author and/or Investopedia and Interactive Brokers is not endorsing or recommending any investment or trading discussed in the material. This material is not and should not be construed as an offer to buy or sell any security. It should not be construed as research or investment advice or a recommendation to buy, sell or hold any security or commodity. This material does not and is not intended to take into account the particular financial conditions, investment objectives or requirements of individual customers. Before acting on this material, you should consider whether it is suitable for your particular circumstances and, as necessary, seek professional advice.
Disclosure: ETFs
Any discussion or mention of an ETF is not to be construed as recommendation, promotion or solicitation. All investors should review and consider associated investment risks, charges and expenses of the investment company or fund prior to investing. Before acting on this material, you should consider whether it is suitable for your particular circumstances and, as necessary, seek professional advice.
Disclosure: Forex
There is a substantial risk of loss in foreign exchange trading. The settlement date of foreign exchange trades can vary due to time zone differences and bank holidays. When trading across foreign exchange markets, this may necessitate borrowing funds to settle foreign exchange trades. The interest rate on borrowed funds must be considered when computing the cost of trades across multiple markets.
Disclosure: Futures Trading
Futures are not suitable for all investors. The amount you may lose may be greater than your initial investment. Before trading futures, please read the CFTC Risk Disclosure. A copy and additional information are available at ibkr.com.
