


![[Gamma] Scalping Please](https://ibkrcampus.com/wp-content/smush-webp/2024/04/tir-featured-8-700x394.jpg.webp "[Gamma] Scalping Please")


I hope that you have had a good start to the new year, and that you know health and stock market success in 2023!
First of all, there is good news for Seasonax users at the beginning of the year. Seasonax is planning to introduce a brand new feature this month: event studies.
Have you ever wondered how stock or commodity prices will behave when futures contracts expire, and when labor market or inflation numbers are published, or when the Fed meets for its FOMC meeting?
As a Seasonax user, this month you will probably be able to find the answers to these questions, as well as many others, all with just a few mouse clicks!
This is a completely new feature, analogous to the annual seasonality you are familiar with, and which will allow you to improve your investment results even further.
So what are event studies?
I would like to show you what event studies are all about using a simple example of FOMC meetings.
Probably the most important issue for stock market participants last year was high inflation rates, and the increase in key interest rates by the U.S. Federal Reserve to combat inflation.
But how do stock prices behave when key interest rates are raised? Is there an empirical correlation that you can use as an investor?
This is how often the FED decides on interest rate hikes
Eight times a year, the Federal Open Market Committee (FOMC) of the U.S. Federal Reserve meets to discuss and decide on monetary policy, and the level of key interest rates.
In view of the continuation of high inflation rates, most recently 7.1%, it is generally expected that a further increase in key interest rates will be decided at the upcoming FOMC meeting. The next FED meeting is scheduled for the turn of this month, January 31 to February.
How do key interest rate hikes affect stock prices?
To answer this question, we will examine the impact on the S&P 500 by looking at the typical course of stock prices before and after the second day of the FED meeting. This is the day on which the interest rate decision is announced.
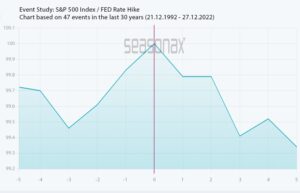
The event chart below shows the average course of the S&P 500 in the five trading days before and after the second day of the FOMC meeting.
The chart was calculated over the past 30 years, during which there have been 47 interest rate hikes. The horizontal axis shows the number of days before, and after, the second day of the relevant FOMC meeting. The vertical axis shows the average trend in percent.
The orange line marks the day of the rate hike. In this way you can see at a glance what the typical course of US share prices looks like around key interest rate increases.
Average performance of the S&P 500 five trading days before and after interest rate hikes at FOMC meetings (1992 to 2022)
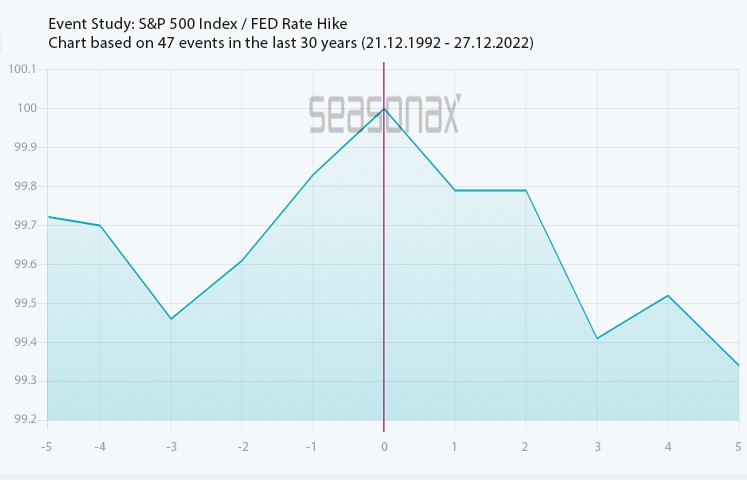
Prices rise and fall only around the rate hike decision. Source: Seasonax
As you can see, stock prices rise three days in advance of the rate hike announcement (by 0.61% on average).
Then they move slightly downwards for two days.
Only on the third day do they react to the interest rate hikes with a relatively sharp decline.
For you as an equity investor, purchases of stocks are thus statistically more favourable several days before or after the rate hike decision, rather than at the time of the FOMC meeting.
You can use this effect as a trader, but also as a long-term investor, to improve your entry timing.
Furthermore, if you use the event feature of Seasonax in the future, you can select a different number of trading days, or a different calculation period. Many event effects last longer than three days. You can also select other instruments such as currencies or commodities, and other events such as economic data releases.
An overview of FOMC meeting dates
Of course, subsequent FED meetings are also of importance, and therefore this is a full list of this year’s FOMC meeting dates.
FED meeting dates 2023:
FOMC meeting January/February: 31/1.
March FOMC meeting: 21-22.
May FOMC meeting: 2-3.
June FOMC meeting: 13-14.
July FOMC meeting: 25-26.
September FOMC meeting: 19-20.
October/November FOMC meeting: 31/1.
December FOMC meeting: 12-13.
FOMC meeting dates for 2024 are expected to be released in June 2023.
Seasonax event studies can further improve your investment results
As you can see, event studies are a brand new Seasonax feature that can help you further improve your investment results.
We are currently in the testing phase and plan to release the event studies before the end of January. We will inform you of this in a separate email.
Of course in the meantime, it is still worthwhile for you to look for good investment opportunities with the seasonality you are familiar with on Seasonax, and increase the probability of good investment results.
So take a look again at www.seasonax.com.
—
Originally Posted January 11, 2023 – Event study: How do key interest rate hikes affect stock prices?
Disclosure: Seasonax
Past results and past seasonal patterns are no indication of future performance, in particular, future market trends. Seasonax GmbH neither recommends nor approves of any particular financial instrument, group of securities, segment of industry, analysis interval or any particular idea, approach, strategy or attitude nor provides consulting nor brokerage nor asset management services. Seasonax GmbH hereby excludes any explicit or implied trading recommendation, in particular, any promise, implication or guarantee that profits are earned and losses excluded, provided, however, that in case of doubt, these terms shall be interpreted in abroad sense. Any information provided by Seasonax GmbH or on this website or any other kind of data media shall not be construed as any kind of guarantee, warranty or representation, in particular as set forth in a prospectus. Any user is solely responsible for the results or the trading strategy that is created, developed or applied. Indicators, trading strategies and functions provided by seasonax GmbH or on this website or any other kind of data media may contain logical or other errors leading to unexpected results, faulty trading signals and/or substantial losses. Seasonax GmbH neither warrants nor guarantees the accuracy, completeness, quality, adequacy or content of the information provided by it or on this website or any other kind of data media. Any user is obligated to comply with any applicable capital market rules of the applicable jurisdiction. All published content and images on this website or any other kind of data media are protected by copyright. Any duplication, processing, distribution or any form of utilisation beyond the scope of copyright law shall require the prior written consent of the author or authors in question. Futures and forex trading contains substantial risk and is not for every investor. An investor could potentially lose all or more than the initial investment. Risk capital is money that can be lost without jeopardizing ones’ financial security or lifestyle. Only risk capital should be used for trading and only those with sufficient risk capital should consider trading. Past performance is not necessarily indicative of future results. Testimonials appearing on this website may not be representative of other clients or customers and is not a guarantee of future performance or success.
Disclosure: Interactive Brokers
Information posted on IBKR Campus that is provided by third-parties does NOT constitute a recommendation that you should contract for the services of that third party. Third-party participants who contribute to IBKR Campus are independent of Interactive Brokers and Interactive Brokers does not make any representations or warranties concerning the services offered, their past or future performance, or the accuracy of the information provided by the third party. Past performance is no guarantee of future results.
This material is from Seasonax and is being posted with its permission. The views expressed in this material are solely those of the author and/or Seasonax and Interactive Brokers is not endorsing or recommending any investment or trading discussed in the material. This material is not and should not be construed as an offer to buy or sell any security. It should not be construed as research or investment advice or a recommendation to buy, sell or hold any security or commodity. This material does not and is not intended to take into account the particular financial conditions, investment objectives or requirements of individual customers. Before acting on this material, you should consider whether it is suitable for your particular circumstances and, as necessary, seek professional advice.


![[Gamma] Scalping Please](https://ibkrcampus.com/wp-content/smush-webp/2024/04/tir-featured-8-300x169.jpg.webp "[Gamma] Scalping Please")