


My visceral reaction upon reading headlines such as Martin Wolf’s “Glimmers of light in a terrible year” in the Financial Times is to counter with positives. I am a glass half full guy, a prerequisite to navigating 2015-20 when pipeline stocks lagged the S&P500 for five years out of six. Wolf says, “Few will regret the passing of 2022” and I must temper my instinctive opposition to such negativity because war broke out in Europe and many families, including my own, lost a loved one. My stepmother sadly passed away in January, and I have only fond memories of her.
But for those who malign 2022 simply because of lousy investment returns, poor asset allocation is the cause. More energy exposure and no bonds would have made the year more agreeable. The case against bonds was so obvious and has been so tirelessly repeated here for years that readers will be spared another exposition (for more detail, see The Continued Sorry Math Of Bonds).
Suffice it to say that central banks starting with the Federal Reserve ($8.5TN), sovereign wealth funds and other return-insensitive buyers have rendered the entire asset class useless to the discerning investor. The Kansas City Fed estimates that Quantitative Easing has lowered ten year treasury yields by 1.6%. What more does a retail bond buyer need to know? For risk reduction just own cash. Duration is for dummies.
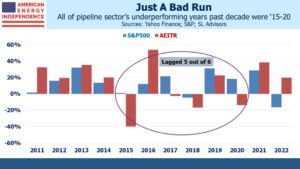
The long 2015-20 dark period convinced many that an allocation to energy was a problem they didn’t need. Equal measures of stubbornness and detailed analysis are character traits of those who remained. By 2020, five out of six underperforming years was definitive to some. Two years later it’s five of the past ten. It was simply a bad run. Investors for whom 2022 will shortly be a fond memory had an overweight to energy, and in many cases to midstream energy infrastructure.
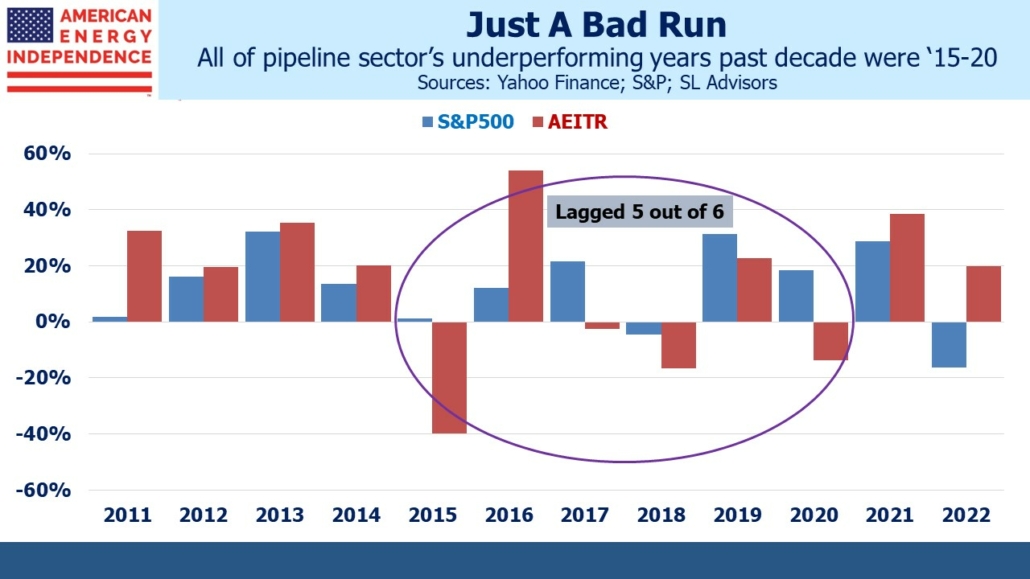
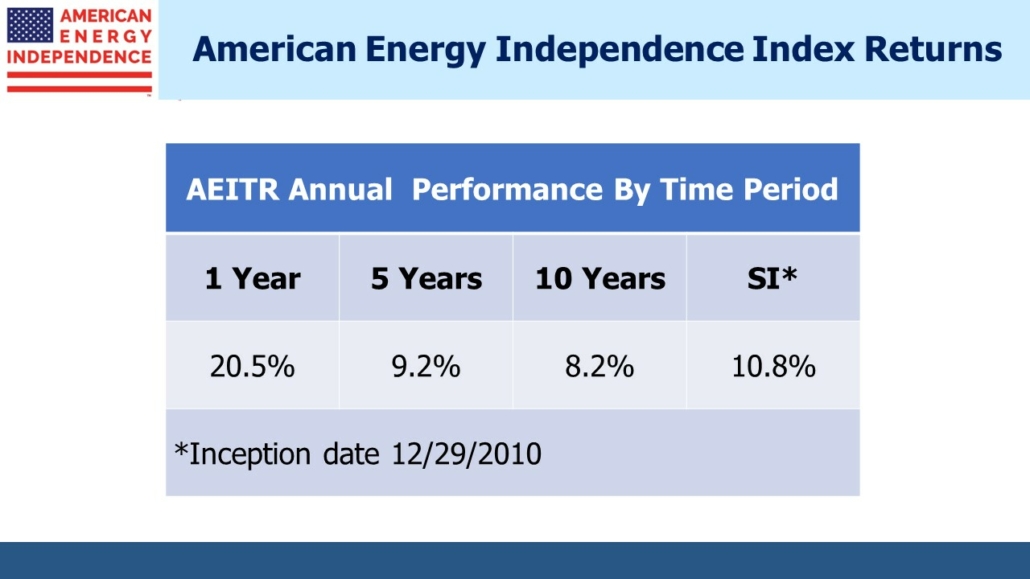
The American Energy Independence Index (AEITR) is +18% YTD, versus –13% for the S&P. One investor estimated that his 2.5% allocation to pipelines had generated almost 1% of outperformance. Wells Fargo notes energy’s rising weight in the S&P500 and concludes it will force more generalists to allocate something if not take an equal weight position. When energy was 2% of the market, a zero weighting might not cause much tracking error. But when energy is 5%, being uninvested during outperformance will be readily apparent to clients.
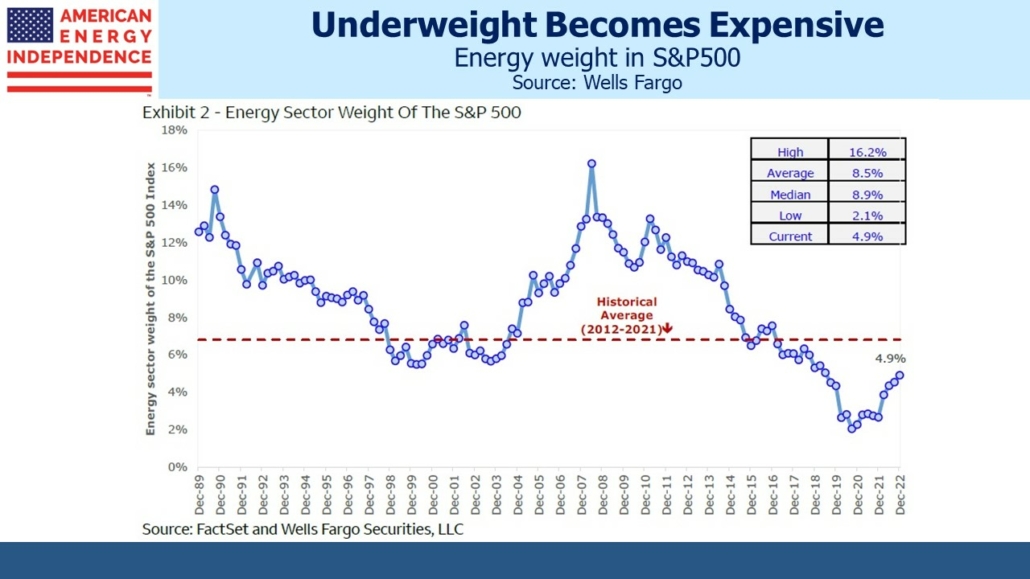
Investors are enjoying the persistence with which pipeline companies are returning cash. Dividend yields of 6% are augmented with buybacks which Wells Fargo estimates will add a further 1% pa to returns over the next five years. Before the shale revolution, MLPs which were then the dominant business structure paid out 90% of their distributable cash flow. Buybacks were unknown. Today the sector is paying out around half its free cash flow in dividends, keeping capex low, reducing leverage and buying back stock. If the widely forecast recession occurs a year from now, this sector will be well positioned to maintain payouts and emerge unscathed.
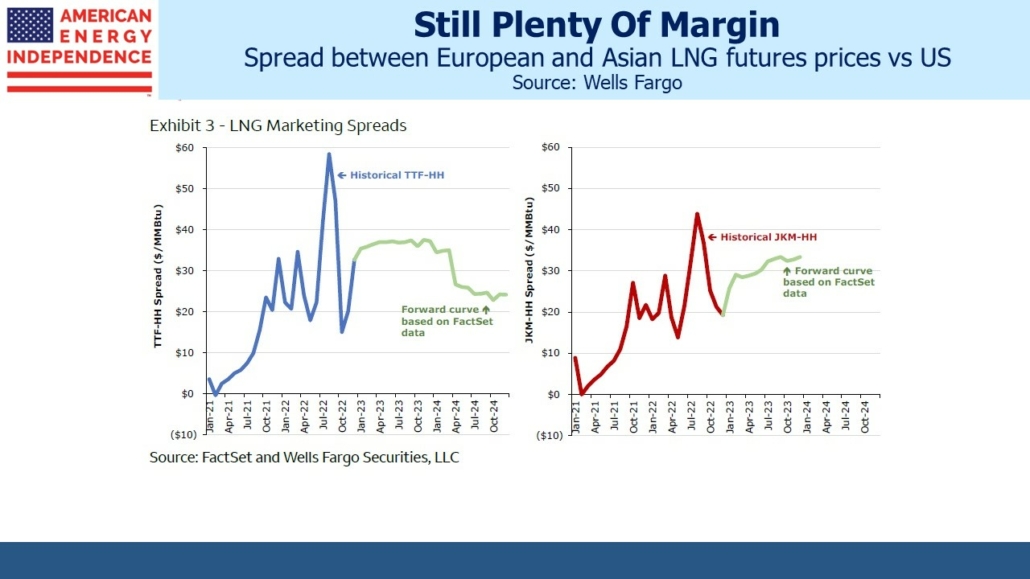
US LNG will enjoy strong demand for many years, even though exports won’t increase much until additional export infrastructure is completed in a couple of years. European and Asian benchmarks are far higher than the US, easily covering the cost of transportation.
NextDecade announced another sale and purchase agreement yesterday with Portuguese buyer Galp Trading. NextDecade expects to announce final investment decision on a three train LNG export facility next quarter. That would likely mean gas, and cash, would start to flow by 2027.
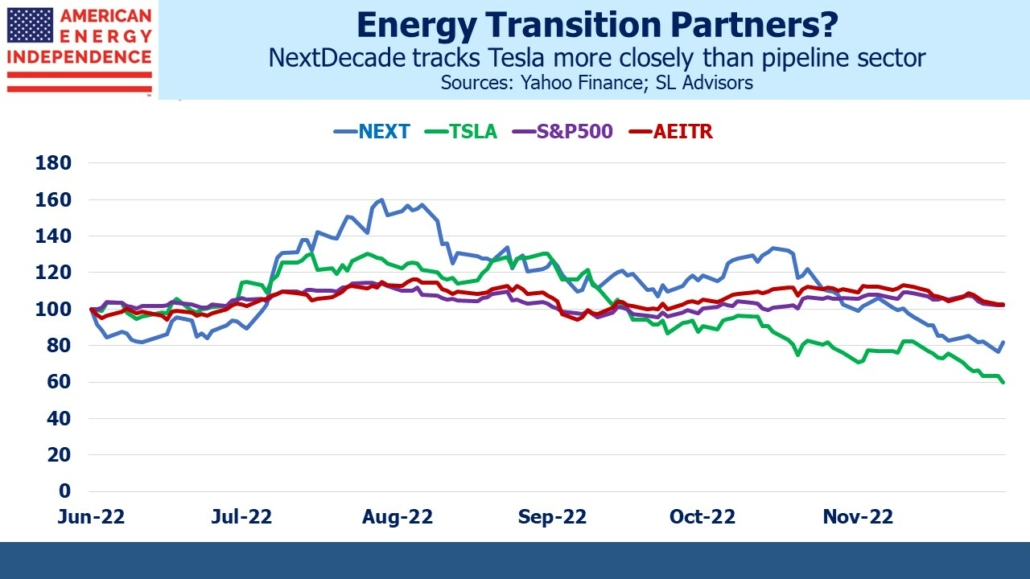
The announcement arrested a steady decline in NextDecade’s stock, which has lost almost half its value since peaking in August. It’s still some years until the company will be valued on free cash flow yield. The market may be recalibrating how much dilution equity investors will endure as they raise capital for a project that will likely cost over $10BN. The current market cap is just over $500MM.
An alternative view is that recent weakness reflects a broader exit from volatile names. Curiously, over the past six months NextDecade is more correlated with Tesla than with the S&P500 or the AEITR. The companies have nothing in common, other than perhaps both being on the right side of the energy transition. One day NextDecade may provide the LNG that foreign utilities will burn to generate the electricity that moves electric vehicles.
Capital discipline, ample dividend coverage and energy’s growing weight in the S&P500 all underpin what we believe is a positive outlook for the pipeline sector heading into 2023. Moreover, ‘40 Act funds in the sector continue to experience outflows (though happily we are seeing inflows). As this retail selling exhausts itself it should provide further upside.
—
Originally Posted December 21, 2022 – Few Got Asset Allocation Right in 2022
Important Disclosures
The information provided is for informational purposes only and investors should determine for themselves whether a particular service, security or product is suitable for their investment needs. The information contained herein is not complete, may not be current, is subject to change, and is subject to, and qualified in its entirety by, the more complete disclosures, risk factors and other terms that are contained in the disclosure, prospectus, and offering. Certain information herein has been obtained from third party sources and, although believed to be reliable, has not been independently verified and its accuracy or completeness cannot be guaranteed. No representation is made with respect to the accuracy, completeness or timeliness of this information. Nothing provided on this site constitutes tax advice. Individuals should seek the advice of their own tax advisor for specific information regarding tax consequences of investments. Investments in securities entail risk and are not suitable for all investors. This site is not a recommendation nor an offer to sell (or solicitation of an offer to buy) securities in the United States or in any other jurisdiction.
References to indexes and benchmarks are hypothetical illustrations of aggregate returns and do not reflect the performance of any actual investment. Investors cannot invest in an index and do not reflect the deduction of the advisor’s fees or other trading expenses. There can be no assurance that current investments will be profitable. Actual realized returns will depend on, among other factors, the value of assets and market conditions at the time of disposition, any related transaction costs, and the timing of the purchase. Indexes and benchmarks may not directly correlate or only partially relate to portfolios managed by SL Advisors as they have different underlying investments and may use different strategies or have different objectives than portfolios managed by SL Advisors (e.g. The Alerian index is a group MLP securities in the oil and gas industries. Portfolios may not include the same investments that are included in the Alerian Index. The S & P Index does not directly relate to investment strategies managed by SL Advisers.)
This site may contain forward-looking statements relating to the objectives, opportunities, and the future performance of the U.S. market generally. Forward-looking statements may be identified by the use of such words as; “believe,” “expect,” “anticipate,” “should,” “planned,” “estimated,” “potential” and other similar terms. Examples of forward-looking statements include, but are not limited to, estimates with respect to financial condition, results of operations, and success or lack of success of any particular investment strategy. All are subject to various factors, including, but not limited to general and local economic conditions, changing levels of competition within certain industries and markets, changes in interest rates, changes in legislation or regulation, and other economic, competitive, governmental, regulatory and technological factors affecting a portfolio’s operations that could cause actual results to differ materially from projected results. Such statements are forward-looking in nature and involves a number of known and unknown risks, uncertainties and other factors, and accordingly, actual results may differ materially from those reflected or contemplated in such forward-looking statements. Prospective investors are cautioned not to place undue reliance on any forward-looking statements or examples. None of SL Advisors LLC or any of its affiliates or principals nor any other individual or entity assumes any obligation to update any forward-looking statements as a result of new information, subsequent events or any other circumstances. All statements made herein speak only as of the date that they were made. r
Certain hyperlinks or referenced websites on the Site, if any, are for your convenience and forward you to third parties’ websites, which generally are recognized by their top level domain name. Any descriptions of, references to, or links to other products, publications or services does not constitute an endorsement, authorization, sponsorship by or affiliation with SL Advisors LLC with respect to any linked site or its sponsor, unless expressly stated by SL Advisors LLC. Any such information, products or sites have not necessarily been reviewed by SL Advisors LLC and are provided or maintained by third parties over whom SL Advisors LLC exercise no control. SL Advisors LLC expressly disclaim any responsibility for the content, the accuracy of the information, and/or quality of products or services provided by or advertised on these third-party sites.
All investment strategies have the potential for profit or loss. Different types of investments involve varying degrees of risk, and there can be no assurance that any specific investment will be suitable or profitable for a client’s investment portfolio.
Past performance of the American Energy Independence Index is not indicative of future returns.
Disclosure: SL Advisors
Please go to following link for important legal disclosures: http://sl-advisors.com/legal-disclosure
SL Advisors is invested in all the components of the American Energy Independence Index via the ETF that seeks to track its performance.
Disclosure: Interactive Brokers
Information posted on IBKR Campus that is provided by third-parties does NOT constitute a recommendation that you should contract for the services of that third party. Third-party participants who contribute to IBKR Campus are independent of Interactive Brokers and Interactive Brokers does not make any representations or warranties concerning the services offered, their past or future performance, or the accuracy of the information provided by the third party. Past performance is no guarantee of future results.
This material is from SL Advisors and is being posted with its permission. The views expressed in this material are solely those of the author and/or SL Advisors and Interactive Brokers is not endorsing or recommending any investment or trading discussed in the material. This material is not and should not be construed as an offer to buy or sell any security. It should not be construed as research or investment advice or a recommendation to buy, sell or hold any security or commodity. This material does not and is not intended to take into account the particular financial conditions, investment objectives or requirements of individual customers. Before acting on this material, you should consider whether it is suitable for your particular circumstances and, as necessary, seek professional advice.
Disclosure: Futures Trading
Futures are not suitable for all investors. The amount you may lose may be greater than your initial investment. Before trading futures, please read the CFTC Risk Disclosure. A copy and additional information are available at ibkr.com.
