


![[Gamma] Scalping Please](https://ibkrcampus.com/wp-content/smush-webp/2024/04/tir-featured-8-700x394.jpg.webp "[Gamma] Scalping Please")


The 60/40 portfolio is off to a good start, as bonds posted gains and global stocks rallied 7.1% in January. As a result, ETFs had $40 billion of inflows, nearly double January’s historical average. Flows were led by the $21 billion into non-US equities (ninth-best ever); US equities had outflows. Meanwhile, bond ETFs added $20 billion of inflows, led by the $7 billion into investment-grade (IG) corporates (third-best ever).
If goldfish have short memories and elephants have long ones, investors need to be part goldfish and part elephant. The goldfish portion helps avoid recency bias and anchoring to the most recent trend or “hot-dot.” It also helps with not fixating on a few days of negative returns. It’s the same concept I relay to my third grade soccer team after the opposing team scores — shake it off and get back in the game (thanks, Ted Lasso).
The elephant side allows investors to stick to their long-term plan by recalling fundamental portfolio construction beliefs. This ranges from rebalancing programs that prevent kneejerk market timing reactions to strategic asset allocation frameworks that let diversification do the heavy lifting during times of market stress.
Balancing goldfish and elephant cognitive thought processes is the trick. Too much goldfish, and investors miss red flags or are unaware that a new trend could have staying power. Goldfish-only investors likely missed how consistent aggressive rate hikes impacted both stocks and bonds last year — and didn’t move fast enough to alter their allocations. Too much elephant, and investors don’t budge off their first principles and become inflexible. For example, they mistakenly believe that they can always rely on a Federal Reserve (Fed) Put.
But investors have kicked off 2023 as goldfish, forgetting the poor returns across asset classes in 2022 and the Fed’s resolve to keep hiking rates to tame inflation. As a result, January inflows were well above their average.
Investors Head Overseas
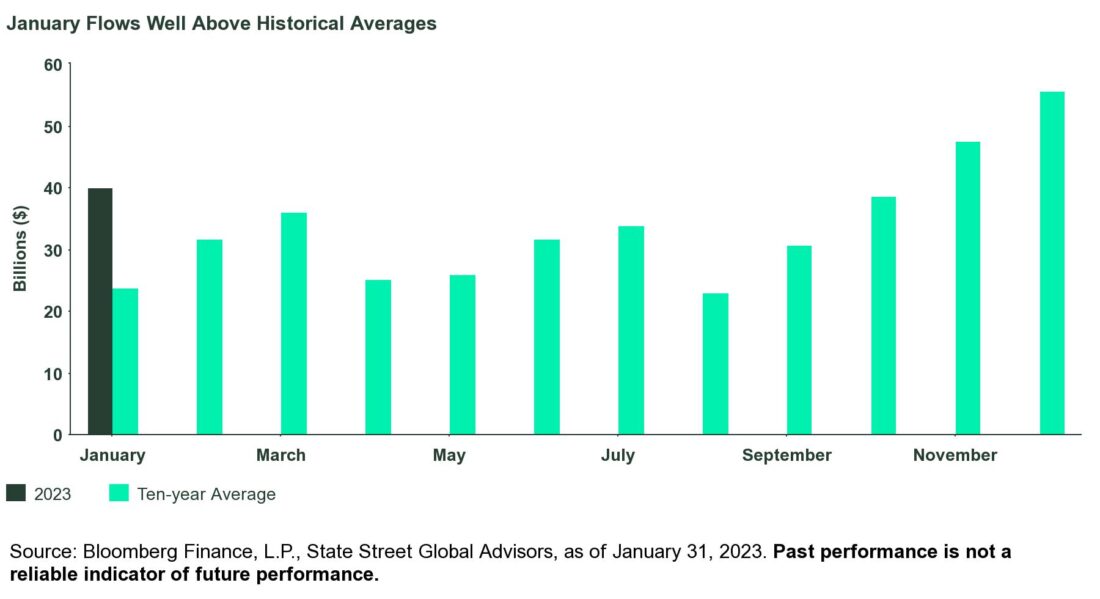
As a result of seasonal effects largely stemming from tax-motivated behavior in equity exposures, January is typically a subdued month for flows. In fact, the 10-year average for January inflows is just $23 billion, the lowest total of any month.
Driven by gains in both stocks and bonds following a dour 2022, where both asset classes fell double digits, January flows got off to a better-than-average start — taking in $40 billion, almost double the monthly average, as shown below.
The above average flows were driven by heighted interest in non-US equities, and for good reason. Relative to US equities, non-US stocks are on their best three-month run since the Global Financial Crisis. In fact, their 13% outperformance over the past three months ranks in the 99th percentile over 20 years.1
A weakening US dollar, fewer downside earnings revisions, China’s re-opening, and more attractive valuations are driving this performance trend. This is investors activating their elephant synapses to recall how liquidity, attractive fundamentals, and macro tailwinds support performance.
Accordingly, international regional ETFs had $5 billion of inflows in January, their most all-time for a month. Regional funds led the non-US equity category with $21 billion of inflows, their ninth-best month ever.
Single-country funds (led by China’s $2 billion of inflows, the fourth-best month ever as investors are finally waking up to a potential rebound) had their fifth-best month ever (+$4 billion). And emerging market (EM) funds added another $5 billion, ranking in the historical 97th percentile.
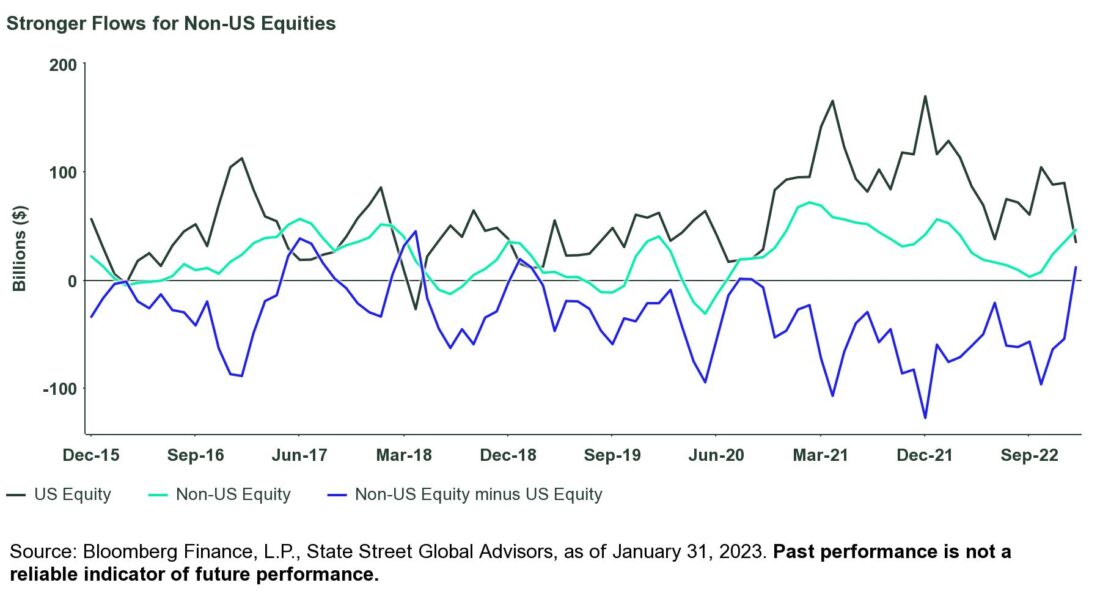
All this occurred as US-focused exposures posted outflows for the first time since April 2022. As a result, the short-term trend has begun to favor non-US exposures, as shown below. On a trailing three-month basis, non-US is now outpacing the US for the first time since 2019 in a material way. But despite the strong recent trend, flows over the past year for non-US exposures remain almost $200 billion below that of US equities — indicating the non-US trade is not yet crowded.
Click here to read the full article
Footnotes
1 Bloomberg Finance, L.P. as of January 31, 2023 based on the performance of the S&P 500 Index and the MSCI World ex-US Index.
2 Bloomberg Finance, L.P as of January 31, 2023 based on the US Dollar Spot Rate.
3 FactSet as of January 31, 2023.
4 FactSet as of January 31, 2023.
5 FactSet as of January 31, 2023.
Glossary
Bloomberg Commodity Index (BCOM)
Calculated on an excess return basis and reflects commodity futures price movements.
Bloomberg US Aggregate Index
Flagship measure of US investment grade debt from a multitude local currency markets. This benchmark includes treasury, government-related, corporate and securitized fixed-rate bonds.
MSCI ACWI Index
Market-capitalization-weighted stock market index that measures the stock performance of the companies in developed and emerging markets.
MSCI World Ex-US Index
Market-capitalization-weighted stock market index that measures the stock performance of the companies in developed markets – excludng the US.
S&P 500® Index
Market-capitalization-weighted stock market index that measures the stock performance of the 500 largest publicly traded companies in the United States.
Smart Beta
Term for rules-based investment strategies that don’t use conventional market-cap weightings.
—
Originally Posted February 6, 2023 – Investors Put 2022 in the Rearview and Double January’s Average ETF Inflow
Disclosure
The views expressed in this material are the views of the SPDR Research and Strategy team and are subject to change based on market and other conditions. It should not be considered a solicitation to buy or an offer to sell any security. It does not take into account any investor’s particular investment objectives, strategies, tax status or investment horizon. There is no representation or warranty as to the current accuracy of such information, nor liability for decisions based on such information. Past performance is not a reliable indicator of future performance.
Unless otherwise noted, all data and statistical information were obtained from Bloomberg LP and SSGA as of January 31, 2023. Data in tables have been rounded to whole numbers, except for percentages, which have been rounded to the nearest tenth of a percent.
The research and analysis included in this document have been produced by SSGA for its own investment management activities and are made available here incidentally. Information obtained from external sources is believed to be reliable and is as of the date of publication but is subject to change. This information must not be used in any jurisdiction where prohibited by law and must not be used in a way that would be contrary to local law or legislation. No investment advice, tax advice, or legal advice is provided herein.
Investing involves risk including the risk of loss of principal.
Bonds generally present less short-term risk and volatility than stocks, but contain interest rate risk (as interest rates raise, bond prices usually fall); issuer default risk; issuer credit risk; liquidity risk; and inflation risk. These effects are usually pronounced for longer-term securities. Any fixed income security sold or redeemed prior to maturity may be subject to a substantial gain or loss.
Equity securities may fluctuate in value in response to the activities of individual companies and general market and economic conditions.
Concentrated investments in a particular sector or industry tend to be more volatile than the overall market and increases risk that events negatively affecting such sectors or industries could reduce returns, potentially causing the value of the Fund’s shares to decrease.
The whole or any part of this work may not be reproduced, copied or transmitted or any of its contents disclosed to third parties without SSGA’s express written consent.
Disclosure: State Street Global Advisors
Do not reproduce or reprint without the written permission of SSGA.
All information has been obtained from sources believed to be reliable, but its accuracy is not guaranteed. There is no representation or warranty as to the current accuracy, reliability or completeness of, nor liability for, decisions based on such information and it should not be relied on as such.
State Street Global Advisors and its affiliates (“SSGA”) have not taken into consideration the circumstances of any particular investor in producing this material and are not making an investment recommendation or acting in fiduciary capacity in connection with the provision of the information contained herein.
ETFs trade like stocks, are subject to investment risk, fluctuate in market value and may trade at prices above or below the ETF’s net asset value. Brokerage commissions and ETF expenses will reduce returns.
Bonds generally present less short-term risk and volatility than stocks, but contain interest rate risk (as interest rates raise, bond prices usually fall); issuer default risk; issuer credit risk; liquidity risk; and inflation risk. These effects are usually pronounced for longer-term securities. Any fixed income security sold or redeemed prior to maturity may be subject to a substantial gain or loss.
Investing involves risk including the risk of loss of principal.
The whole or any part of this work may not be reproduced, copied or transmitted or any of its contents disclosed to third parties without SSGA’s express written consent.
Investing in high yield fixed income securities, otherwise known as “junk bonds”, is considered speculative and involves greater risk of loss of principal and interest than investing in investment grade fixed income securities. These Lower-quality debt securities involve greater risk of default or price changes due to potential changes in the credit quality of the issuer.
COPYRIGHT AND OTHER RIGHTS
Other third party content is the intellectual property of the respective third party and all rights are reserved to them. All rights reserved. No organization or individual is permitted to reproduce, distribute or otherwise use the statistics and information in this report without the written agreement of the copyright owners.
Definition:
Arbitrage: the simultaneous buying and selling of securities, currency, or commodities in different markets or in derivative forms in order to take advantage of differing prices for the same asset.
Fund Objectives:
SPY: The investment seeks to provide investment results that, before expenses, correspond generally to the price and yield performance of the S&P 500® Index. The Trust seeks to achieve its investment objective by holding a portfolio of the common stocks that are included in the index (the “Portfolio”), with the weight of each stock in the Portfolio substantially corresponding to the weight of such stock in the index.
VOO: The investment seeks to track the performance of a benchmark index that measures the investment return of large-capitalization stocks. The fund employs an indexing investment approach designed to track the performance of the Standard & Poor’s 500 Index, a widely recognized benchmark of U.S. stock market performance that is dominated by the stocks of large U.S. companies. The advisor attempts to replicate the target index by investing all, or substantially all, of its assets in the stocks that make up the index, holding each stock in approximately the same proportion as its weighting in the index.
IVV: The investment seeks to track the investment results of the S&P 500 (the “underlying index”), which measures the performance of the large-capitalization sector of the U.S. equity market. The fund generally invests at least 90% of its assets in securities of the underlying index and in depositary receipts representing securities of the underlying index. It may invest the remainder of its assets in certain futures, options and swap contracts, cash and cash equivalents, as well as in securities not included in the underlying index, but which the advisor believes will help the fund track the underlying index.
The funds presented herein have different investment objectives, costs and expenses. Each fund is managed by a different investment firm, and the performance of each fund will necessarily depend on the ability of their respective managers to select portfolio investments. These differences, among others, may result in significant disparity in the funds’ portfolio assets and performance. For further information on the funds, please review their respective prospectuses.
Entity Disclosures:
The trademarks and service marks referenced herein are the property of their respective owners. Third party data providers make no warranties or representations of any kind relating to the accuracy, completeness or timeliness of the data and have no liability for damages of any kind relating to the use of such data.
SSGA Funds Management, Inc. serves as the investment advisor to the SPDR ETFs that are registered with the United States Securities and Exchange Commission under the Investment Company Act of 1940. SSGA Funds Management, Inc. is an affiliate of State Street Global Advisors Limited.
Intellectual Property Disclosures:
Standard & Poor’s®, S&P® and SPDR® are registered trademarks of Standard & Poor’s® Financial Services LLC (S&P); Dow Jones is a registered trademark of Dow Jones Trademark Holdings LLC (Dow Jones); and these trademarks have been licensed for use by S&P Dow Jones Indices LLC (SPDJI) and sublicensed for certain purposes by State Street Corporation. State Street Corporation’s financial products are not sponsored, endorsed, sold or promoted by SPDJI, Dow Jones, S&P, their respective affiliates and third party licensors and none of such parties make any representation regarding the advisability of investing in such product(s) nor do they have any liability in relation thereto, including for any errors, omissions, or interruptions of any index.
BLOOMBERG®, a trademark and service mark of Bloomberg Finance, L.P. and its affiliates, and BARCLAYS®, a trademark and service mark of Barclays Bank Plc., have each been licensed for use in connection with the listing and trading of the SPDR Bloomberg Barclays ETFs.
Distributor: State Street Global Advisors Funds Distributors, LLC, member FINRA, SIPC, an indirect wholly owned subsidiary of State Street Corporation. References to State Street may include State Street Corporation and its affiliates. Certain State Street affiliates provide services and receive fees from the SPDR ETFs.
ALPS Distributors, Inc., member FINRA, is distributor for SPDR® S&P 500®, SPDR® S&P MidCap 400® and SPDR® Dow Jones Industrial Average, all unit investment trusts. ALPS Distributors, Inc. is not affiliated with State Street Global Advisors Funds Distributors, LLC.
Before investing, consider the funds’ investment objectives, risks, charges, and expenses. For SPDR funds, you may obtain a prospectus or summary prospectus containing this and other information by calling 1‐866‐787‐2257 or visiting www.spdrs.com. Please read the prospectus carefully before investing.
Disclosure: Interactive Brokers
Information posted on IBKR Campus that is provided by third-parties does NOT constitute a recommendation that you should contract for the services of that third party. Third-party participants who contribute to IBKR Campus are independent of Interactive Brokers and Interactive Brokers does not make any representations or warranties concerning the services offered, their past or future performance, or the accuracy of the information provided by the third party. Past performance is no guarantee of future results.
This material is from State Street Global Advisors and is being posted with its permission. The views expressed in this material are solely those of the author and/or State Street Global Advisors and Interactive Brokers is not endorsing or recommending any investment or trading discussed in the material. This material is not and should not be construed as an offer to buy or sell any security. It should not be construed as research or investment advice or a recommendation to buy, sell or hold any security or commodity. This material does not and is not intended to take into account the particular financial conditions, investment objectives or requirements of individual customers. Before acting on this material, you should consider whether it is suitable for your particular circumstances and, as necessary, seek professional advice.
Disclosure: ETFs
Any discussion or mention of an ETF is not to be construed as recommendation, promotion or solicitation. All investors should review and consider associated investment risks, charges and expenses of the investment company or fund prior to investing. Before acting on this material, you should consider whether it is suitable for your particular circumstances and, as necessary, seek professional advice.


![[Gamma] Scalping Please](https://ibkrcampus.com/wp-content/smush-webp/2024/04/tir-featured-8-300x169.jpg.webp "[Gamma] Scalping Please")