


By: Greg Wilensky, CFA and Jeremiah Buckley, CFA
Portfolio Managers Jeremiah Buckley and Greg Wilensky discuss why, despite a challenging year in 2022, they believe the long-term benefits of the 60/40 portfolio remain intact.
Key takeaways:
- Following a tough year in 2022, when both stocks and bonds recorded materially negative calendar-year returns, some investors are questioning the viability of 60/40 portfolios going forward.
- In our view, the significantly negative returns on both stocks and bonds in 2022 was a rare event, and investors should not necessarily conclude that the relationship between stocks and bonds has changed fundamentally.
- We think the big reset in rates and valuations in 2022 has repositioned 60/40 strategies to deliver the strong risk-adjusted returns once again that investors have come to expect.
While returns on financial assets in 2022 left many investors frustrated, those holding balanced portfolios have reason to feel particularly aggrieved, having just experienced their worst year of returns since the Global Financial Crisis (GFC). Investors who hold balanced portfolios (typically a 60/40 allocation to stocks and bonds) generally do so because the strategy has, over time, yielded better risk-adjusted returns by limiting drawdowns versus equity-only strategies. The key tenet underlying the balanced approach is that stocks and bonds have historically tended to move in opposite directions during times of financial market stress.
The 60/40 portfolio boasts an impressive track record: Prior to 2022, it delivered positive returns in 35 of the previous 41 years. But in 2022, the strategy didn’t work as investors have come to expect, recording a -16.9% return as the Bloomberg U.S. Aggregate Bond Index (U.S. Agg) logged its worst year on record, and the S&P 500® Index simultaneously experienced its seventh-worst year since the Great Depression.
Naturally, many investors have started to question whether the game is up, and if traditional stock-bond diversification is dead? Has the multi-decade symbiotic relationship between stocks and bonds come to a bitter and abrupt end?
Returns: 2022 was a rarity
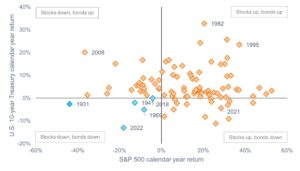
In our view, it is vital for investors to grasp how rare 2022 was from a return perspective. Much of the move down in asset prices was triggered by the Federal Reserve’s (Fed) aggressive rate hikes (4.25% within the calendar year) as it sought to rein in runaway inflation. But, as shown in Figure 1, the combined effect of the rate hikes on stocks and bonds was highly unusual, as they both ended the year down for only the fifth time since 1928.
Figure 1: Stocks and bonds have simultaneously experienced negative calendar-year returns in only five of the past 95 years.
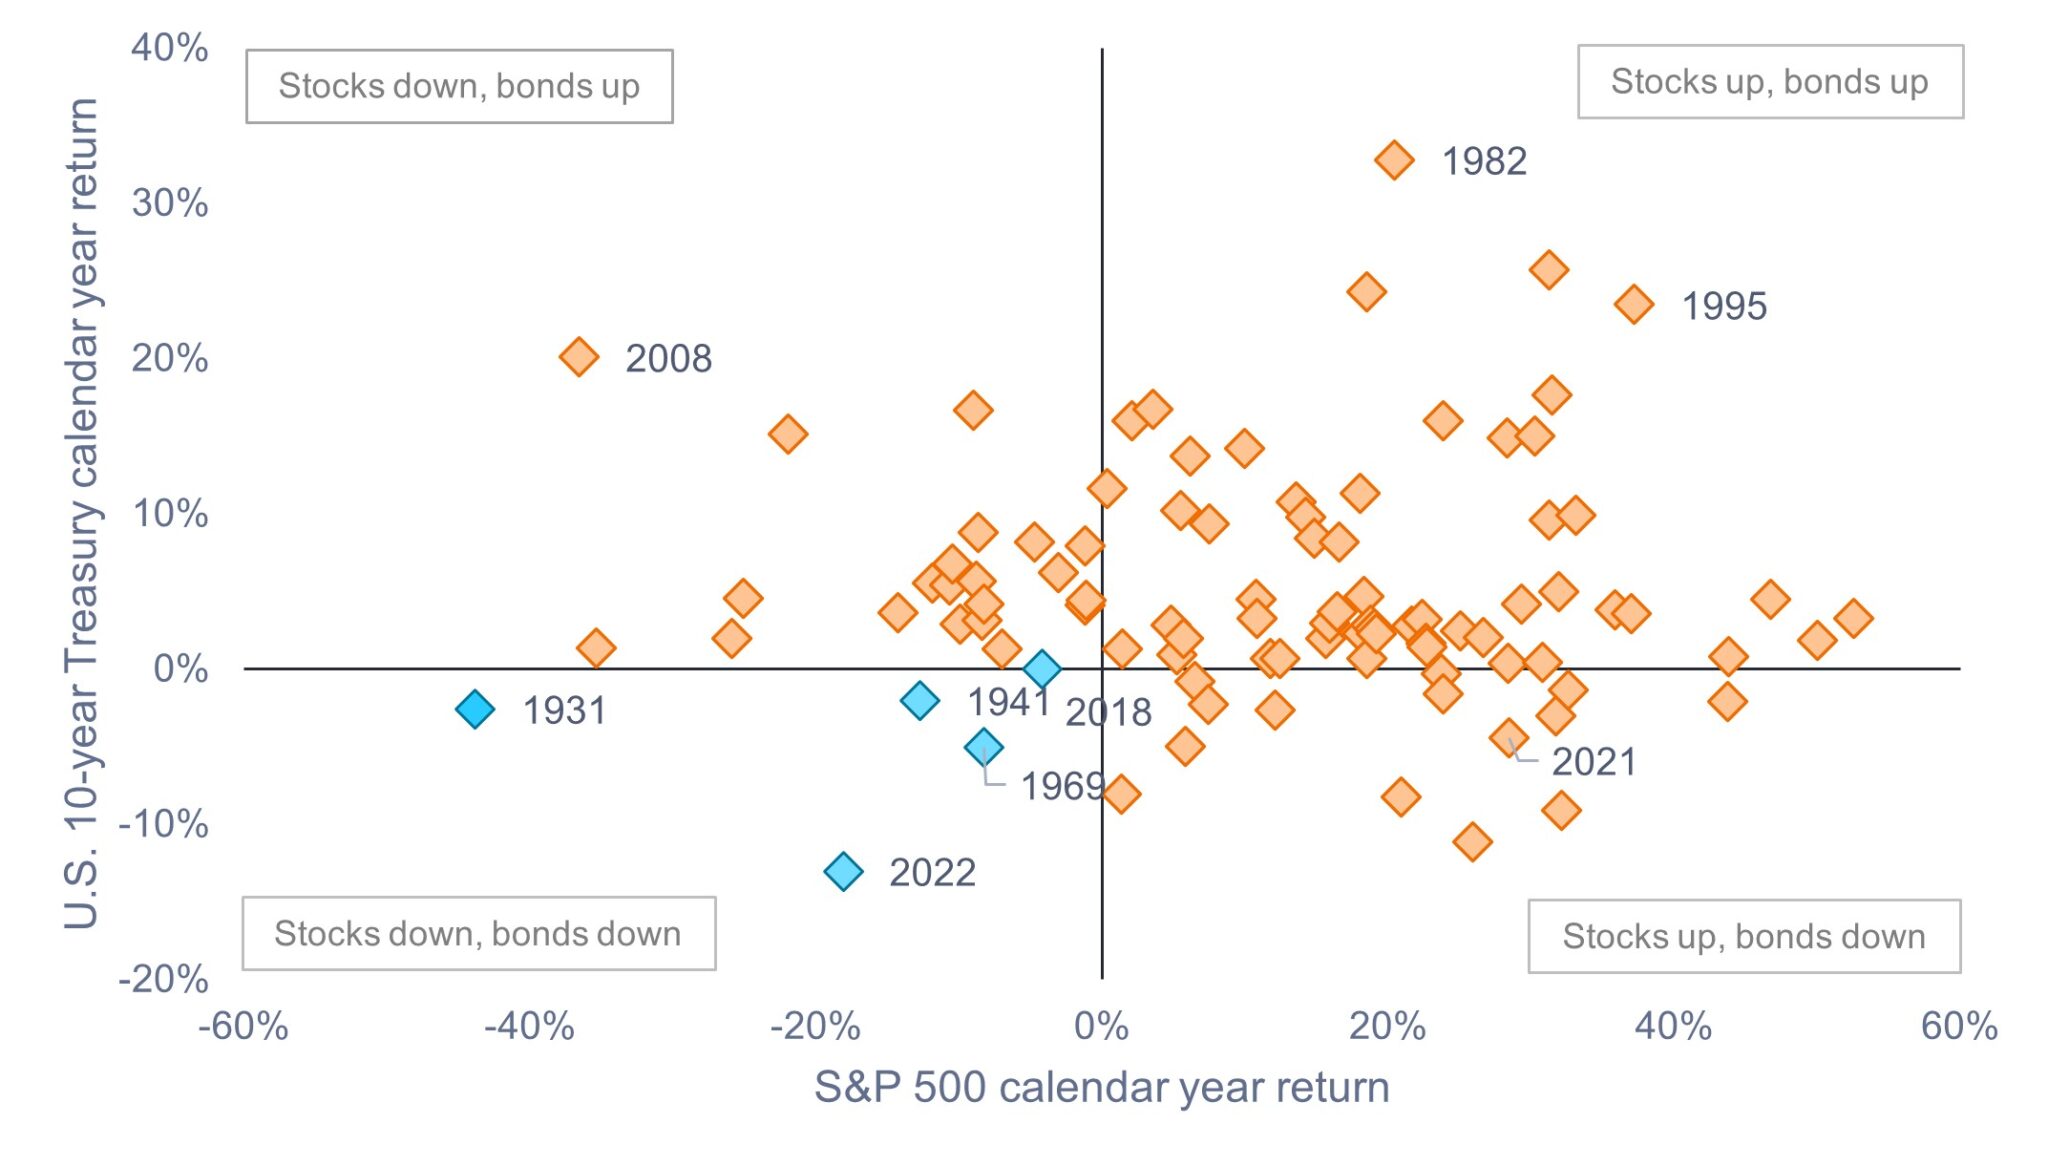
Source: Bloomberg, Morningstar, NYU Stern, as of December 31, 2022.
Notes: S&P 500 Index total returns and 10-year U.S. Treasury Bond total returns, 1928-2022. Blue squares represent years in which both stocks and bonds were down, orange squares represent years in which stocks were up and bonds were down, or bonds were up and stocks were down, or both stocks and bonds were up.
Correlations: 2022 was not that unusual
As the debate over the balanced portfolio’s future rages on, critics of the 60/40 portfolio have pointed to the sharp increase in the correlation between stock and bond returns in 2022. Their argument? If bonds and stocks are now moving in lockstep with one another, of what use are bonds as a diversifier? In our view, however, investors would do well to consider a longer-term view of correlation. As shown in Figure 2, over the past 30 years, stock-bond correlations have fluctuated significantly on a 1-year rolling basis, and on a 3-year rolling basis have remained either positive or negative for long periods of time. Yet, despite the short-term swings, stock-bond correlation has on average been close to zero. It is not unusual for correlations to rise over the short term and, as such, we do not see evidence to substantiate a theory that the fundamental relationship between stocks and bonds has broken down.
Figure 2: Stock-bond correlation (1990 – 2022)
It is common for correlation to fluctuate, but on average it has been close to zero.
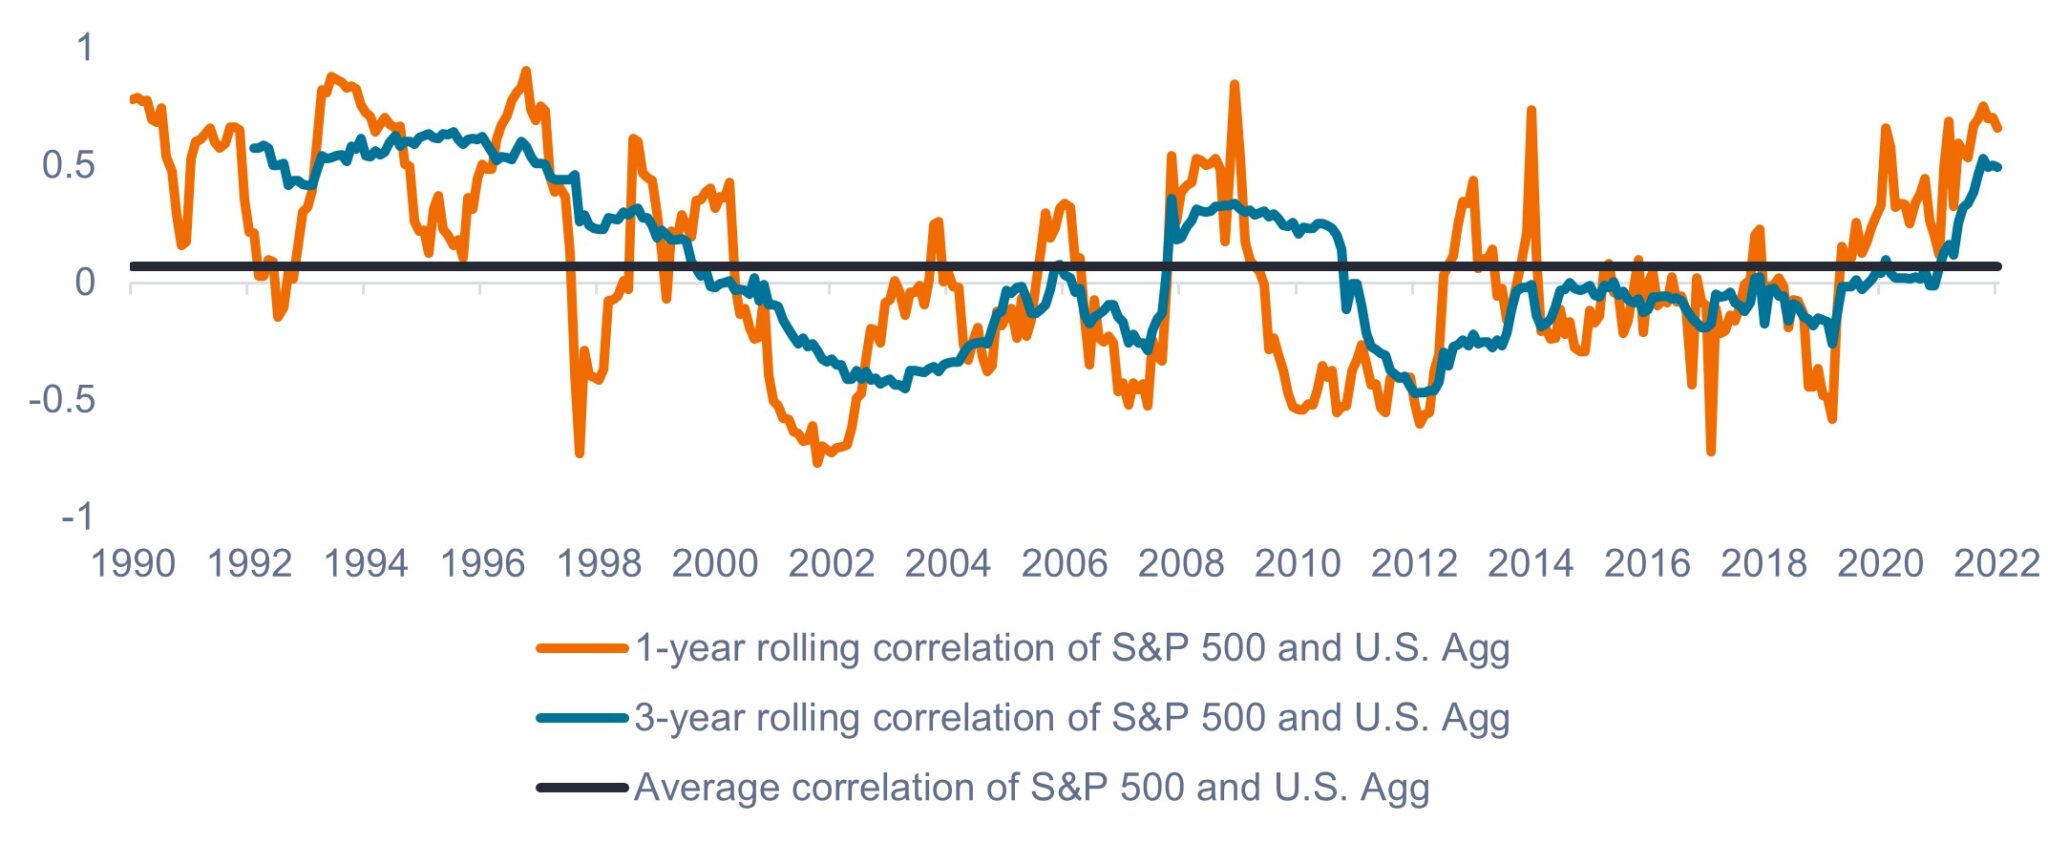
Source: Janus Henderson Investors, as of December 31, 2022.
Note: Rolling correlation of S&P 500 Index and Bloomberg U.S. Aggregate Bond Index using monthly total returns. Past performance does not predict future returns.
Reflecting and moving forward
As investors pause to evaluate their portfolio performance in 2022 and chart their course for 2023, we believe there are two key points to consider.
First, investors should keep 2022 in perspective. The markets experienced a significant repricing of risk by way of higher interest rates, and while it was painful to go through, one should be careful not to misinterpret a single year as a change in a long-term relationship. We would advocate against making any large or sudden moves in reaction to what happened in 2022; rather, we believe investors should only adjust their asset allocation in response to a change in their long-term goals or risk tolerance. Bad years do happen; that’s simply the nature of putting capital to work. But tough years can help guide investors toward self-reflection and a re-evaluation of their investment objectives to ensure their allocation is the right one for the long term. Additionally, for investors in 60/40 portfolios lamenting the losses from 2022, it is important to note that balanced portfolios have historically recovered sooner than equity-only portfolios, as shown in Figure 3.
Figure 3: Peak-to-trough drawdowns
The 60/40 portfolio has historically experienced lower drawdowns and quicker recoveries versus equity-only portfolios.
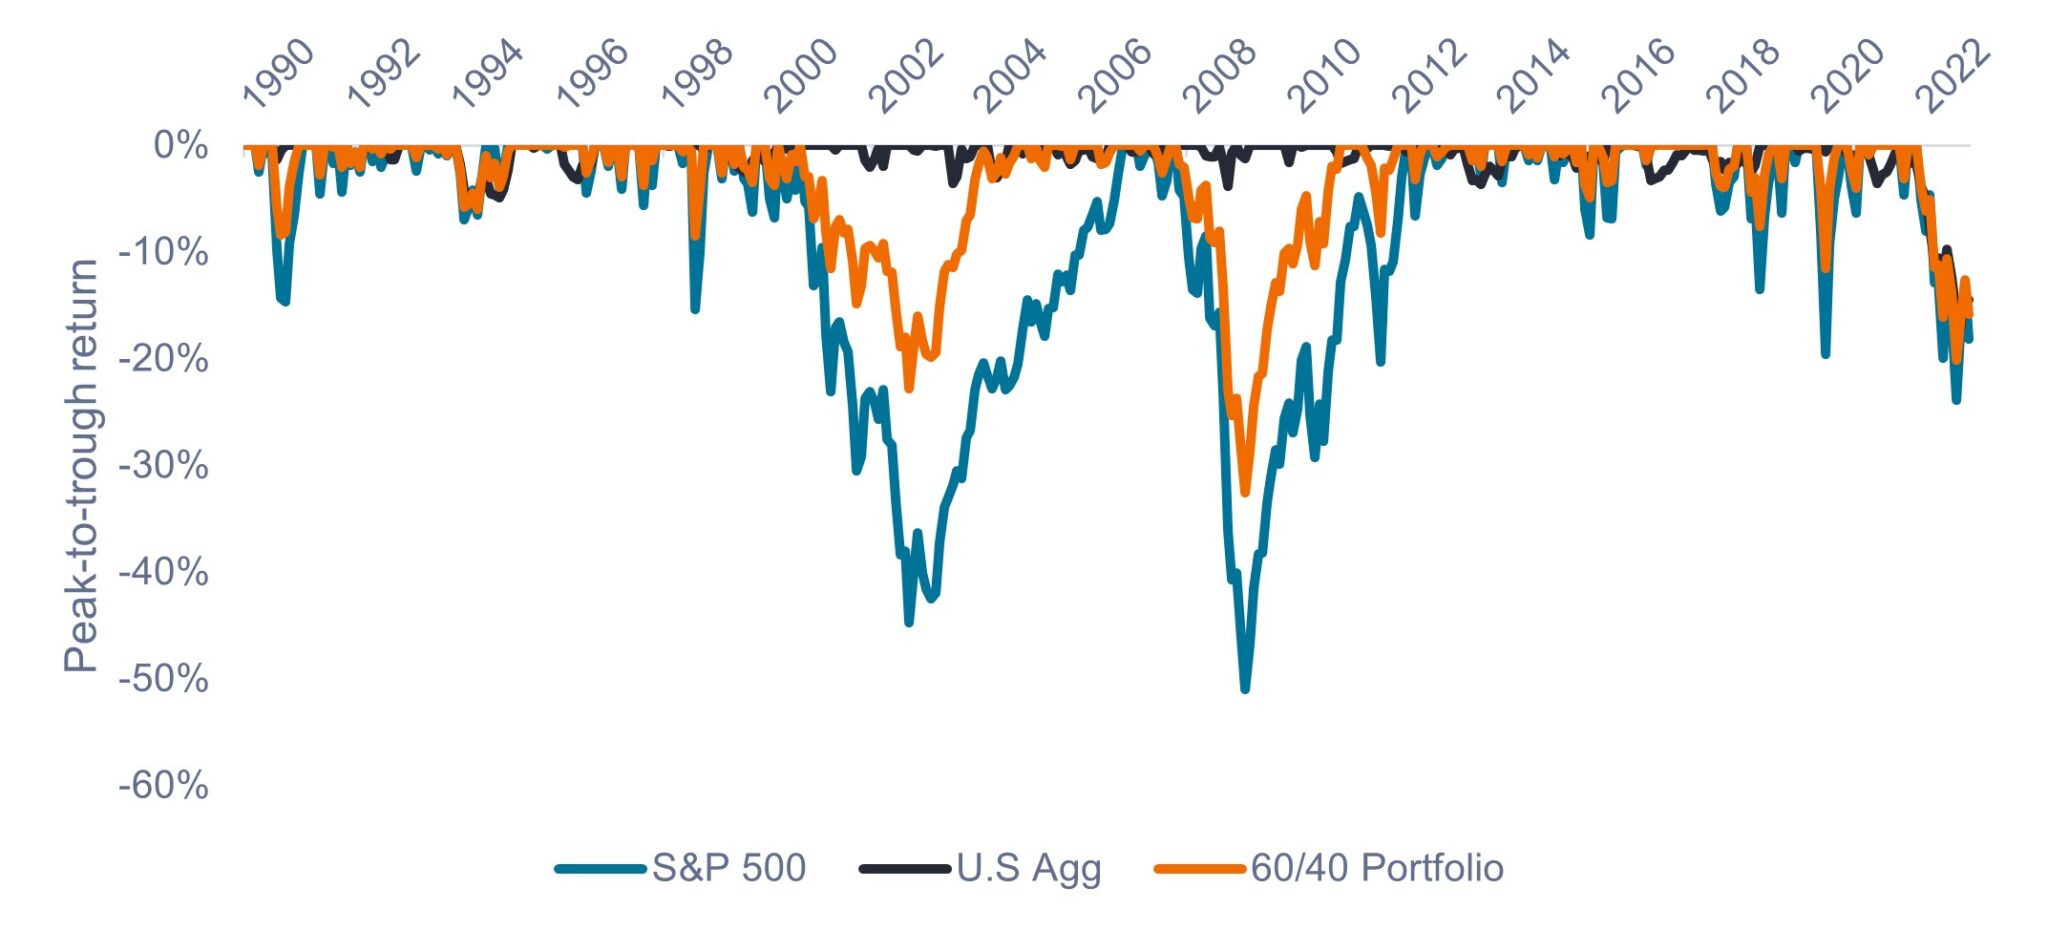
Source: Janus Henderson Investors, Bloomberg, as of December 31, 2022.
Notes: Peak-to-trough drawdowns on S&P 500 Index, Bloomberg U.S. Aggregate Bond Index, and hypothetical blended 60/40 portfolio. Past performance does not predict future returns.
Second, we think investors should be forward looking in their portfolio positioning. The silver lining from 2022 is that both equities and bonds are in a much better place now than they were a year ago. For fixed income, as inflation continues to trend downward, we believe most of the increase in rates is behind us. After many years of zero-policy rates, investors are finally getting income from their fixed income allocations, as bonds are now offering some of the most attractive yields since the GFC. Additionally, in our view, fixed income is better positioned to provide much-needed diversification and serve as a ballast in portfolios should economic conditions worsen in the year ahead.
As for equities, multiples now appear to be in a more reasonable range, and we think the reset in valuations has created opportunities. Prior to the Fed’s policy tightening in 2022, inexpensive capital broadly supported all companies, whereas the new environment could favor a more active approach and individual stock picking. Rather than broad groups of stocks leading based on general trends or factors, we believe relative performance will be more dependent on dynamics at the individual company level. In this market, we think innovation in products and services, effective capital allocation, and management’s ability to contain costs and gain productivity from resources (both physical resources and labor) as well as the skill to utilize capacity at efficient levels will all be integral in determining companies’ growth.
Adding active and dynamic management to the 60/40 construct
In summary, we believe that an active, dynamic approach to managing a balanced portfolio may prove beneficial in the years ahead. We think tighter monetary policy could favor a more active approach within each asset class, with opportunities for active managers to pick individual stocks and bonds with superior cash flow and balance sheet metrics.
Similarly, we think investors might benefit from managers that have somewhat flexible mandates to dynamically adjust a portfolio around the 60/40 mix instead of being too tightly bound to the benchmark allocation. This flexible approach can seek to take advantage of relative value opportunities between stocks and bonds while still benefitting from the 60/40 portfolio’s structural advantages.
IMPORTANT INFORMATION
Equity securities are subject to risks including market risk. Returns will fluctuate in response to issuer, political and economic developments.
Fixed income securities are subject to interest rate, inflation, credit and default risk. The bond market is volatile. As interest rates rise, bond prices usually fall, and vice versa. The return of principal is not guaranteed, and prices may decline if an issuer fails to make timely payments or its credit strength weakens.
Actively managed portfolios may fail to produce the intended results. No investment strategy can ensure a profit or eliminate the risk of loss.
Diversification neither assures a profit nor eliminates the risk of experiencing investment losses.
No investment strategy can ensure a profit or eliminate the risk of loss.
Definitions
Balanced 40/60 Index is an internally calculated, hypothetical monthly rebalanced blend of 40% S&P 500 and 60% Bloomberg US Aggregate Bond Indices.
Bloomberg U.S. Aggregate Bond Index is a broad-based measure of the investment grade, US dollar-denominated, fixed-rate taxable bond market.
Correlation measures the degree to which two variables move in relation to each other. A value of 1.0 implies movement in parallel, -1.0 implies movement in opposite directions, and 0.0 implies no relationship.
Quantitative Tightening (QT) is a government monetary policy occasionally used to decrease the money supply by either selling government securities or letting them mature and removing them from its cash balances.
S&P 500® Index reflects U.S. large-cap equity performance and represents broad U.S. equity market performance.
10-Year Treasury Yield is the interest rate on U.S. Treasury bonds that will mature 10 years from the date of purchase.
—
Originally Posted February 2, 2023 – Is stock-bond diversification dead?
Disclosure: Janus Henderson
The opinions and views expressed are as of the date published and are subject to change without notice. They are for information purposes only and should not be used or construed as an offer to sell, a solicitation of an offer to buy, or a recommendation to buy, sell or hold any security, investment strategy or market sector. No forecasts can be guaranteed. Opinions and examples are meant as an illustration of broader themes and are not an indication of trading intent. It is not intended to indicate or imply that any illustration/example mentioned is now or was ever held in any portfolio. Janus Henderson Group plc through its subsidiaries may manage investment products with a financial interest in securities mentioned herein and any comments should not be construed as a reflection on the past or future profitability. There is no guarantee that the information supplied is accurate, complete, or timely, nor are there any warranties with regards to the results obtained from its use. Past performance is no guarantee of future results. Investing involves risk, including the possible loss of principal and fluctuation of value.
Disclosure: Interactive Brokers
Information posted on IBKR Campus that is provided by third-parties does NOT constitute a recommendation that you should contract for the services of that third party. Third-party participants who contribute to IBKR Campus are independent of Interactive Brokers and Interactive Brokers does not make any representations or warranties concerning the services offered, their past or future performance, or the accuracy of the information provided by the third party. Past performance is no guarantee of future results.
This material is from Janus Henderson and is being posted with its permission. The views expressed in this material are solely those of the author and/or Janus Henderson and Interactive Brokers is not endorsing or recommending any investment or trading discussed in the material. This material is not and should not be construed as an offer to buy or sell any security. It should not be construed as research or investment advice or a recommendation to buy, sell or hold any security or commodity. This material does not and is not intended to take into account the particular financial conditions, investment objectives or requirements of individual customers. Before acting on this material, you should consider whether it is suitable for your particular circumstances and, as necessary, seek professional advice.
