


After achieving an 817% total return between March 2009 and the end of 2021, the S&P 500® fell 18.5% in 2022. Despite losing nearly one fifth of its value, the index might not be a bargain buy on some measures. When one looks at the S&P 500 market capitalization to GDP ratio, it’s around 140%. That’s below its 2021 peak of 180%, but far above any other post-World War Two level, including its peaks in the 1960s and 2000 (Figure 1).
Figure 1: Even after last year’s selloff, stocks remain highly valued & dependent on low yields
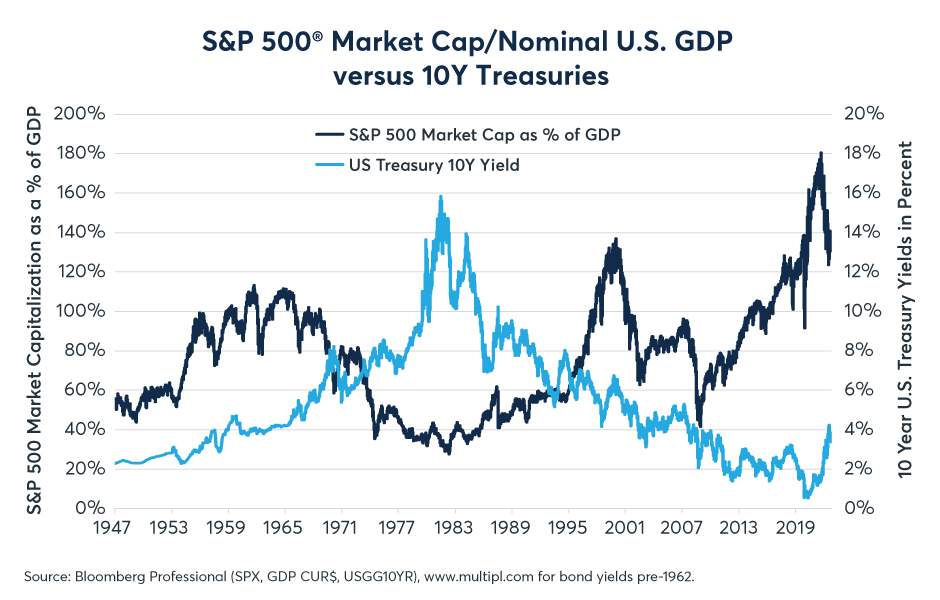
Equity investors experienced long periods of declines following the 1966 and 2000 peaks. Amid relatively high inflation from the late 1960s to the early 1980s, the S&P 500 went nowhere in nominal terms and lost 70% in real terms (when adjusted for inflation). Following its March 2000 high, the index suffered back-to-back bear markets and by March 2009 had shed 60% of its value. Could we be in the early stages of a similar period of turbulence?
Dividend futures might provide some insight. Launched in January 2015, S&P 500 Annual Dividend Index futures allow investors to hedge against fluctuations in the aggregate dividend payments of the various companies in the index for the current year and subsequent 10 years.
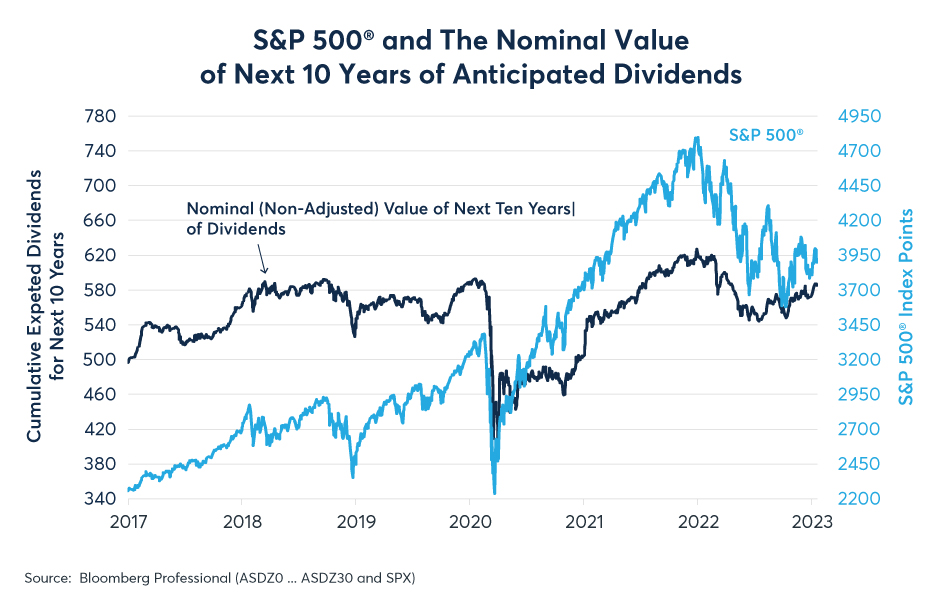
When one tallies up the current year contract with the 10 subsequent years since 2017, one finds that market expectations for dividends over the coming decade have been virtually unchanged since early 2018. Generally, investors have anticipated the payment of around 580 index points worth of S&P 500 dividends over the coming decade. The number dipped slightly in early 2020 and then recovered. Crucially, it never advanced any further even as the S&P 500 itself rose from around 2,700 points in early 2017 to around 4,000 today (Figure 2).
Figure 2: The value of expected dividends hasn’t changed since 2019 even as stocks rose about 50%
In theory, equity investors should be less concerned with the nominal value of the anticipated future dividends than they are with their net present value (NPV). If one discounts the value of the anticipated future dividends back into present value, one finds that the S&P 500 moved more-or-less in lockstep with the NPV of future dividends from 2016 to March 2020, trading at a ratio of six times the NPV of the coming decade’s anticipated dividend payments.
Starting in March 2020, the S&P 500 sharply diverged from its previous relationship with the NPV of future dividends (Figure 3). March 2020 was also the month that the Federal Reserve (Fed) embarked on a $4.9 trillion quantitative easing (QE) program, in which it created $3.0 trillion of liquidity in three months and then continued to expand its balance sheet by as much as $120 billion per month for the next two years. Post-March 2020, the S&P 500 went from trading at 6x the NPV of anticipated dividends to 8x. It’s only during the past seven months that the Fed has begun to reverse its QE program (Figure 4), and while the S&P 500 has fallen, its ratio versus the NPV of future dividends has not moved.
Figure 3: The NPV of anticipated dividends moved in lockstep with the S&P until the Fed began QE
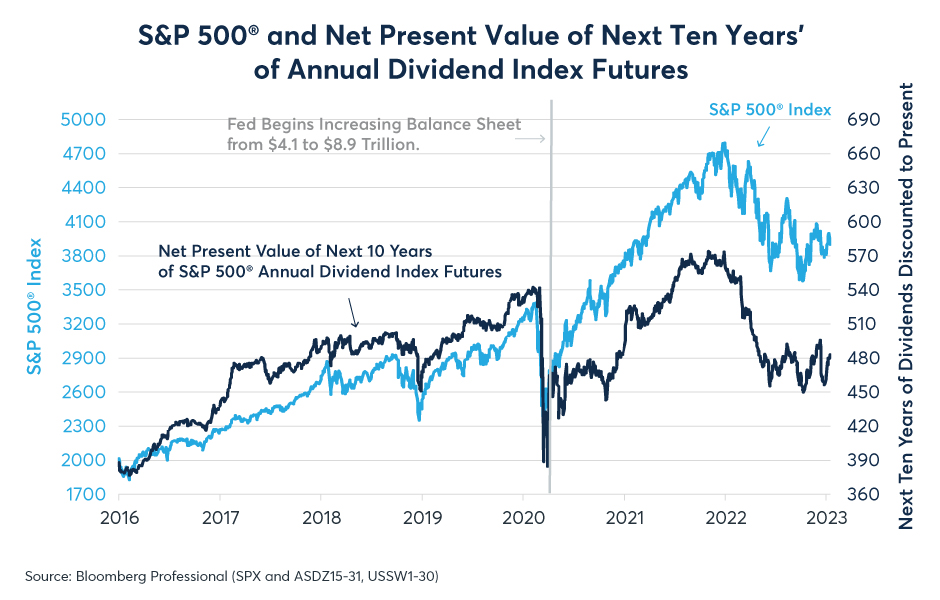
Figure 4: How much did the Fed’s QE inflate the value of the U.S. stock market?
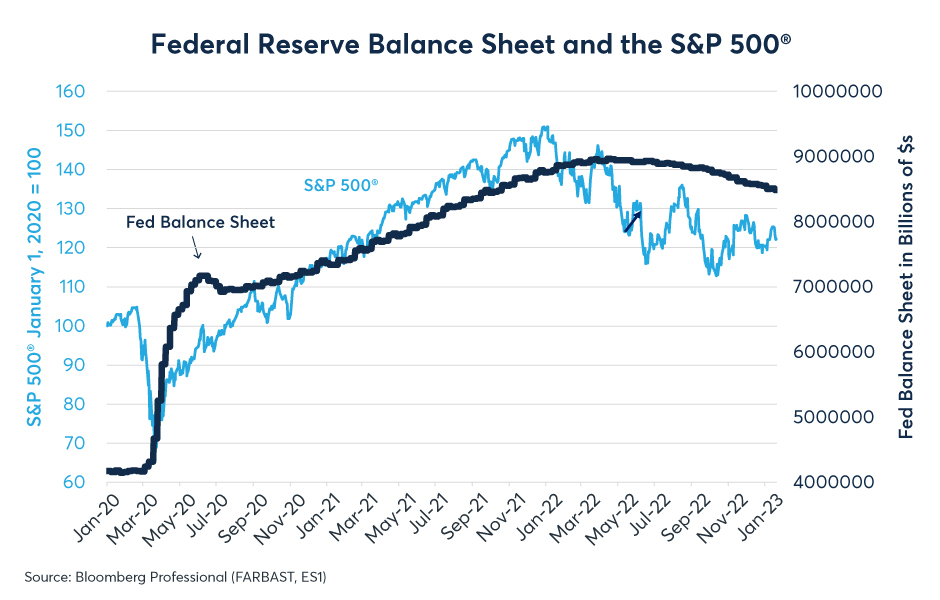
As of this writing, the S&P 500 is still trading at about 33% above its pre-pandemic/pre-$4.9 trillion QE ratio versus the NPV of future anticipated dividends. If, hypothetically, the S&P 500 were to return to its pre-pandemic ratio to the NPV of future dividends, that would involve shaving off 1,000 index points, or roughly 25% of the value of the index. However, before jumping to conclusions about what could happen in the future, let’s consider three more optimistic scenarios:
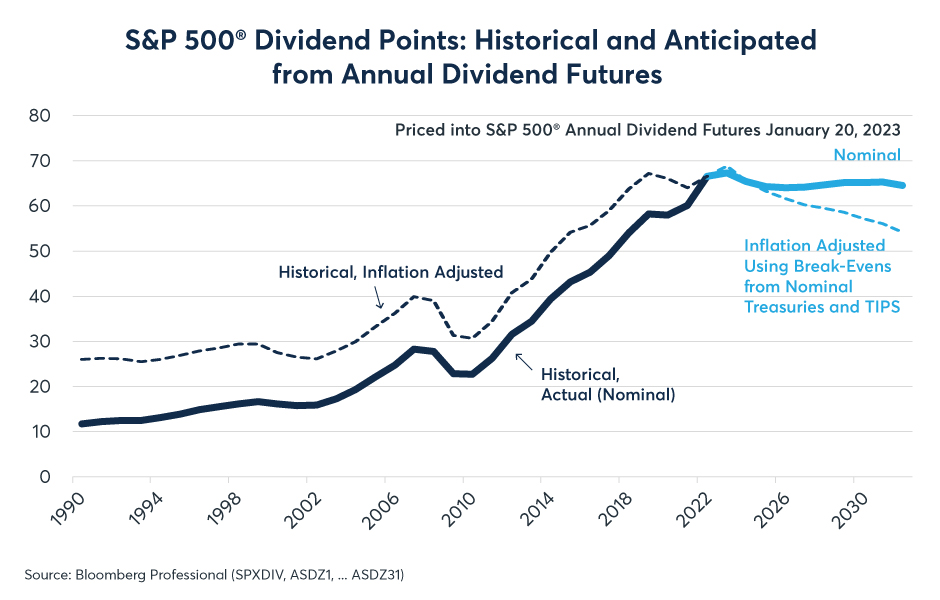
1) Investors could become more optimistic about future dividend payments. For the moment, investors view the future with some pessimism, anticipating essentially zero growth in dividend payments between now and December 2033 in nominal terms and an outright decline in real terms (Figure 5). This isn’t just true of the S&P 500, it’s also true of dividend futures on the Nasdaq 100 and the Russell 2000. It is possible that dividend growth could be better than investors expect. In 2022, for example, 66.19 index points worth of dividends were paid out on the S&P, 10.7% higher than the year before. Nasdaq and Russell dividends grew as well.
Figure 5: As of mid-January, investors priced no growth in S&P dividends over the coming decade
2) Interest rates could fall. If interest rates were to fall, this would, by definition, increase the NPV of future cash flows. A large part of the reason why the market rose in 2019 was because interest rates were falling across the yield curve, boosting the value of future cash flows even as expectations for future dividends in nominal terms barely moved. If inflation subsides and bonds rally, an analogous scenario could unfold with the S&P 500/NPV of anticipated future dividend payment ratio falling even if investors don’t necessarily become more optimistic about dividend growth.
3) The ratio of the S&P 500 doesn’t necessarily have to come back to its pre-pandemic levels. It may be that there was nothing extraordinary about the market’s pre-pandemic relationship with the NPV of future dividends that made its 2017-2019 ratios more “correct” or better than its current ratios. That said, if the S&P 500 ratio over the NPV of anticipated dividends was inflated by $4.9 trillion of QE, quantitative tightening risks causing that ratio to come back down to earth.
Despite these three optimistic scenarios, there are still reasons to be concerned. If interest rates fall as a result of an economic downturn caused by the Fed’s monetary tightening, the impact on dividends and markets could become complicated. On the one hand lower rates could boost the NPV of future dividends, while on the other any downturn in economic growth could produce a dip in actual dividend payments. Between October 2007 and March 2009, bond yields plunged but equity markets suffered and dividend payments shrank by over 20% amid an economic downturn.
—
Originally Posted January 31, 2023 – Is the S&P 500 Overvalued?
All examples in this report are hypothetical interpretations of situations and are used for explanation purposes only. The views in this report reflect solely those of the author and not necessarily those of CME Group or its affiliated institutions. This report and the information herein should not be considered investment advice or the results of actual market experience.
Disclosure: Interactive Brokers
Information posted on IBKR Campus that is provided by third-parties does NOT constitute a recommendation that you should contract for the services of that third party. Third-party participants who contribute to IBKR Campus are independent of Interactive Brokers and Interactive Brokers does not make any representations or warranties concerning the services offered, their past or future performance, or the accuracy of the information provided by the third party. Past performance is no guarantee of future results.
This material is from CME Group and is being posted with its permission. The views expressed in this material are solely those of the author and/or CME Group and Interactive Brokers is not endorsing or recommending any investment or trading discussed in the material. This material is not and should not be construed as an offer to buy or sell any security. It should not be construed as research or investment advice or a recommendation to buy, sell or hold any security or commodity. This material does not and is not intended to take into account the particular financial conditions, investment objectives or requirements of individual customers. Before acting on this material, you should consider whether it is suitable for your particular circumstances and, as necessary, seek professional advice.
Disclosure: Futures Trading
Futures are not suitable for all investors. The amount you may lose may be greater than your initial investment. Before trading futures, please read the CFTC Risk Disclosure. A copy and additional information are available at ibkr.com.

