


![[Gamma] Scalping Please](https://ibkrcampus.com/wp-content/smush-webp/2024/04/tir-featured-8-700x394.jpg.webp "[Gamma] Scalping Please")


MBS Rallies to Weaker CPI, Diminished Supply Headwinds
U.S. Agency Mortgages began the month meandering toward another subpar performance until November 10th’s CPI report altered the rates landscape. A surprisingly weak figure rallied rates and more importantly rallied MBS to new Index heights, this just two months after plunging new depths.
U.S. 10yr note yields shaved basis points off the previous highs (4.21%), and the 2s/10s curve steepened 26 basis points before its inevitable resumption to inversion. Price action was supported as well, rallying 3 points across the entire MBS index, with a month-end rally added in for good measure.
MBS tends to do better in rallying markets, as the bulk of the outstanding universe still resides in discounted coupons with longer average lives that feed off longer end outperformances. In fuller and shorter coupons, intermittent outperformance vs. the lower stack was rare yet noticeable along 6%s and 6.5%s. 7%s have also seen a modest uptick in activity though “quoted” markets still lack trading frequency of their lower coupon compatriots.
Originator supply has really taken a more dramatic turn lower, with daily TBA hedging down to $1.6B from $2.6B as recent as August 2022. 53% of those hedged coupons lie between 5.5%s, and 6.5%s this past month, as borrowers pay points up front to avoid the stigma of paying a 7% interest rate.
While the month was a resounding success, outperformances were capped on occasion as money managers and hedge funds continued to police the tights, selling the basis focused on “belly” coupons 4.5%s through 5.5%s. Markets tend to ebb and sway with wides bought up and tights sold so don’t expect too much relative outperformance as we head to year end.
Dollar roll markets remained sedate with only fuller 6.5%s and 7%s nearing or exceeding carry (breakeven). In fact, the “picture” along FNMA 7% roll is a 10/32nds bid, 6/32nds below carry/break even (using a conservative 10CPR that infers new production filtering in over more seasoned paper).
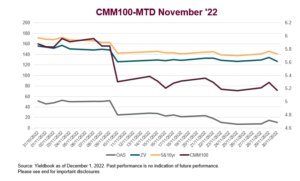
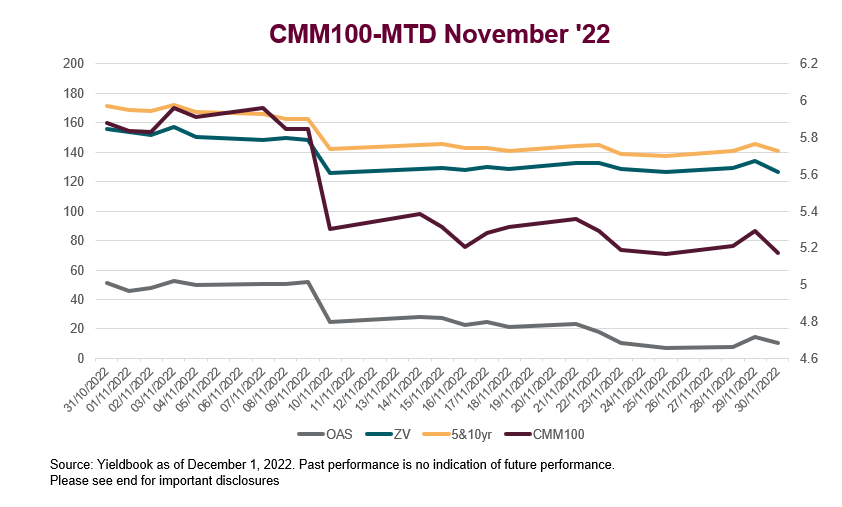
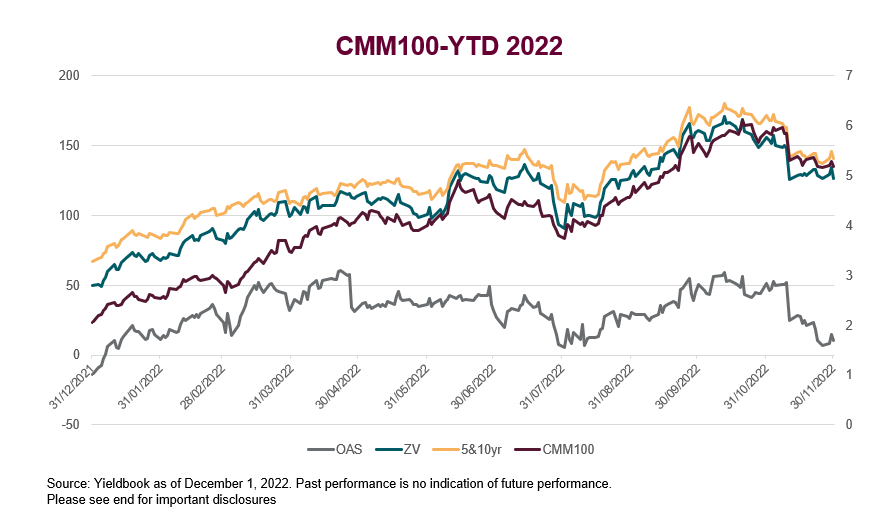
MONTH TO DATE; Spreads had an outstanding month, firming dramatically, post-CPI print as noted above, with the par based current coupon lowering 70.5 basis points to 5.174%. OAS spreads were equally impressive tightening 40.7 basis points to 10.196, while ZV spreads narrowed 29.158 bps (126.5), and measures against the frequently watched 5&10yr Treasury blend tightened 30.5 bps to +141.14.
YEAR TO DATE: Results are in a different mode annually, as 11 months of rising and widening haven’t been reversed out just yet; 30yr CC +312bps, OAS +23bps, ZV +76bps and vs the 5&10yr treasury blend +74bps.
Market Perspective
More activity has been occurring in the upper 30yr stack of UMBS, with markets traded along 6.5%s and bid ask more regularly quoted on 7%s.
We felt it timely to explore further using Scenario Analysis that employs a curve shift ahead of the upcoming December Fed meeting (Dec 13th/14th).
The recent Fed Speak language bandied about appears to lean more towards a 50bps tightening as opposed to the previous 75bps sentiment. This leads us to a summary of +/- 100 basis points scenario, better encapsulating, we hope, the immediate rates backdrop horizon.
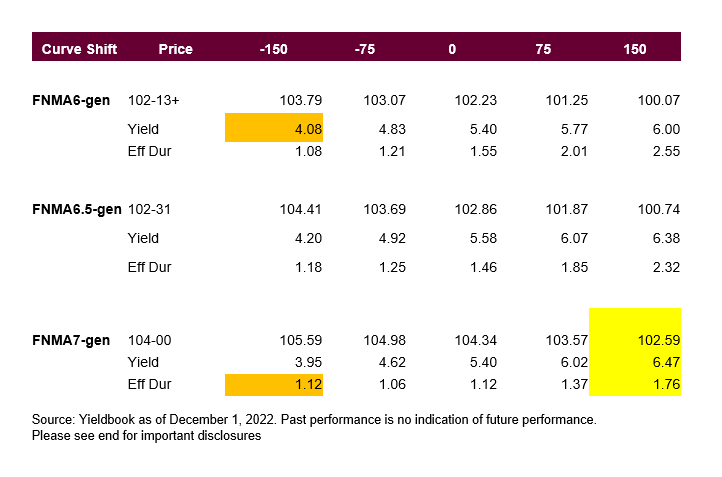
Of the three upper coupons examined, fuller 7%s hold up best in an up rates environment owing to their slightly shorter profile and more current coupon back to the bondholder. Prepayments are less of a consideration given the massive refinancing that has already occurred in the market.
However, the composition of the TBA itself is key here. If the model incorporates newer and longer pools for instance on 30yr 7%s, even as limited issuance says otherwise, then it will hold up better as rates rally than one would intuitively think.
Performance into a rally is split here across the 3 coupons listed, as each offers attributes in their own accord as profiles are intermediate to shorter life to begin with.
The main proponent of this sector is a more current coupon return, as opposed to a duration play as the results bore out. Therefore, little differential is mined setting one against the other.
For more on MBS performance, and on other asset class performance, subscribe to the blog.
—
Originally Posted December 2, 2022 – November ‘22 U.S. MBS Agency Market Recap
Disclosure: FTSE Russell
Interactive Advisors, a division of Interactive Brokers Group, offers FTSE Russell Index Tracker portfolios on its online investing marketplace. Learn more about the Diversified Portfolios.
This material is not intended as investment advice. Interactive Advisors or portfolio managers on its marketplace may hold long or short positions in the companies mentioned through stocks, options or other securities.
© 2023 London Stock Exchange Group plc and its applicable group undertakings (the “LSE Group”). The LSE Group includes (1) FTSE International Limited (“FTSE”), (2) Frank Russell Company (“Russell”), (3) FTSE Global Debt Capital Markets Inc. and FTSE Global Debt Capital Markets Limited (together, “FTSE Canada”), (4) MTSNext Limited (“MTSNext”), (5) Mergent, Inc. (“Mergent”), (6) FTSE Fixed Income LLC (“FTSE FI”), (7) The Yield Book Inc (“YB”) and (8) Beyond Ratings S.A.S. (“BR”). All rights reserved.
FTSE Russell® is a trading name of FTSE, Russell, FTSE Canada, MTSNext, Mergent, FTSE FI, YB and BR. “FTSE®”, “Russell®”, “FTSE Russell®”, “MTS®”, “FTSE4Good®”, “ICB®”, “Mergent®”, “The Yield Book®”, “Beyond Ratings®“ and all other trademarks and service marks used herein (whether registered or unregistered) are trademarks and/or service marks owned or licensed by the applicable member of the LSE Group or their respective licensors and are owned, or used under licence, by FTSE, Russell, MTSNext, FTSE Canada, Mergent, FTSE FI, YB or BR. FTSE International Limited is authorised and regulated by the Financial Conduct Authority as a benchmark administrator.
All information is provided for information purposes only. All information and data contained in this publication is obtained by the LSE Group, from sources believed by it to be accurate and reliable. Because of the possibility of human and mechanical error as well as other factors, however, such information and data is provided “as is” without warranty of any kind. No member of the LSE Group nor their respective directors, officers, employees, partners or licensors make any claim, prediction, warranty or representation whatsoever, expressly or impliedly, either as to the accuracy, timeliness, completeness, merchantability of any information or of results to be obtained from the use of the FTSE Russell products, including but not limited to indexes, data and analytics or the fitness or suitability of the FTSE Russell products for any particular purpose to which they might be put. Any representation of historical data accessible through FTSE Russell products is provided for information purposes only and is not a reliable indicator of future performance.
No responsibility or liability can be accepted by any member of the LSE Group nor their respective directors, officers, employees, partners or licensors for (a) any loss or damage in whole or in part caused by, resulting from, or relating to any error (negligent or otherwise) or other circumstance involved in procuring, collecting, compiling, interpreting, analysing, editing, transcribing, transmitting, communicating or delivering any such information or data or from use of this document or links to this document or (b) any direct, indirect, special, consequential or incidental damages whatsoever, even if any member of the LSE Group is advised in advance of the possibility of such damages, resulting from the use of, or inability to use, such information.
No member of the LSE Group nor their respective directors, officers, employees, partners or licensors provide investment advice and nothing contained herein or accessible through FTSE Russell products, including statistical data and industry reports, should be taken as constituting financial or investment advice or a financial promotion.
Past performance is no guarantee of future results. Charts and graphs are provided for illustrative purposes only. Index returns shown may not represent the results of the actual trading of investable assets. Certain returns shown may reflect back-tested performance. All performance presented prior to the index inception date is back-tested performance. Back-tested performance is not actual performance, but is hypothetical. The back-test calculations are based on the same methodology that was in effect when the index was officially launched. However, back- tested data may reflect the application of the index methodology with the benefit of hindsight, and the historic calculations of an index may change from month to month based on revisions to the underlying economic data used in the calculation of the index.
This document may contain forward-looking assessments. These are based upon a number of assumptions concerning future conditions that ultimately may prove to be inaccurate. Such forward-looking assessments are subject to risks and uncertainties and may be affected by various factors that may cause actual results to differ materially. No member of the LSE Group nor their licensors assume any duty to and do not undertake to update forward-looking assessments.
No part of this information may be reproduced, stored in a retrieval system or transmitted in any form or by any means, electronic, mechanical, photocopying, recording or otherwise, without prior written permission of the applicable member of the LSE Group. Use and distribution of the LSE Group data requires a licence from FTSE, Russell, FTSE Canada, MTSNext, Mergent, FTSE FI, YB, BR and/or their respective licensors.
Disclosure: Interactive Brokers
Information posted on IBKR Campus that is provided by third-parties does NOT constitute a recommendation that you should contract for the services of that third party. Third-party participants who contribute to IBKR Campus are independent of Interactive Brokers and Interactive Brokers does not make any representations or warranties concerning the services offered, their past or future performance, or the accuracy of the information provided by the third party. Past performance is no guarantee of future results.
This material is from FTSE Russell and is being posted with its permission. The views expressed in this material are solely those of the author and/or FTSE Russell and Interactive Brokers is not endorsing or recommending any investment or trading discussed in the material. This material is not and should not be construed as an offer to buy or sell any security. It should not be construed as research or investment advice or a recommendation to buy, sell or hold any security or commodity. This material does not and is not intended to take into account the particular financial conditions, investment objectives or requirements of individual customers. Before acting on this material, you should consider whether it is suitable for your particular circumstances and, as necessary, seek professional advice.
