


![[Gamma] Scalping Please](https://ibkrcampus.com/wp-content/smush-webp/2024/04/tir-featured-8-700x394.jpg.webp "[Gamma] Scalping Please")


- Aerospace & defense industry growth will be supported by the FY 2023 National Defense Appropriation Act which likely marks the start of a new cycle of increased defense spending
- Regional banks show strong profitability, quality balance sheets, and attractive valuations in a favorable interest rate environment
- Pharmaceuticals may provide investors greater exposure to quality and value than the broad Health Care sector
US equities ushered in the new year with many headwinds — multi-decade high inflation, continuous monetary tightening, and lower economic growth. While inflation continues to cool l down, it is still too early for the Federal Reserve (Fed) to claim victory over inflation and change to a neutral monetary stance. High inflation and soft aggregated demand will keep downward pressure on corporate profitability. Against this backdrop, we picked three industries with strong industry demand and pricing power, attractive valuations, and high quality traits to position portfolios for the economic downturn without missing the inflection point for the inevitable recovery.
Aerospace & Defense
Last year, US aerospace & defense stocks had their best year in more than 20 years on a relative basis, beating the broad market by more than 30%.1 But the industry still lags the broad market by 18% from its pre-pandemic level.2 As countries continue boosting defense spending amid elevated geopolitical tensions, while the broader economy grapples with softening demand and high inflation, we see potential for further outperformance in the industry for 2023.
Increased defense spending is one of few areas with bipartisan support in the split Congress. In December, the FY 2023 National Defense Appropriation Act (NDAA) was passed with wide bipartisan support, authorizing a record $858 billion in defense spending — $45 billion more than President Biden’s budget request and a 10% increase from the FY 2022 enacted amount.3 If the budget is fully implemented this year, it would be the highest annual growth rate in defense spending in almost two decades.
Besides addressing the effects of inflation, the FY 2023 NDAA increased the funding to assist Ukraine by $500 million from last year and set up a specific defense modernization program authorizing up to $10 billion over the next five years for Taiwan to deter aggression by China.4 The FY 2023 NDAA likely marks the start of a new cycle of increased defense spending, as intensifying great power competition and aging US defense systems call for more investment in the coming years to achieve US defense and security goals in a “decisive decade.”5
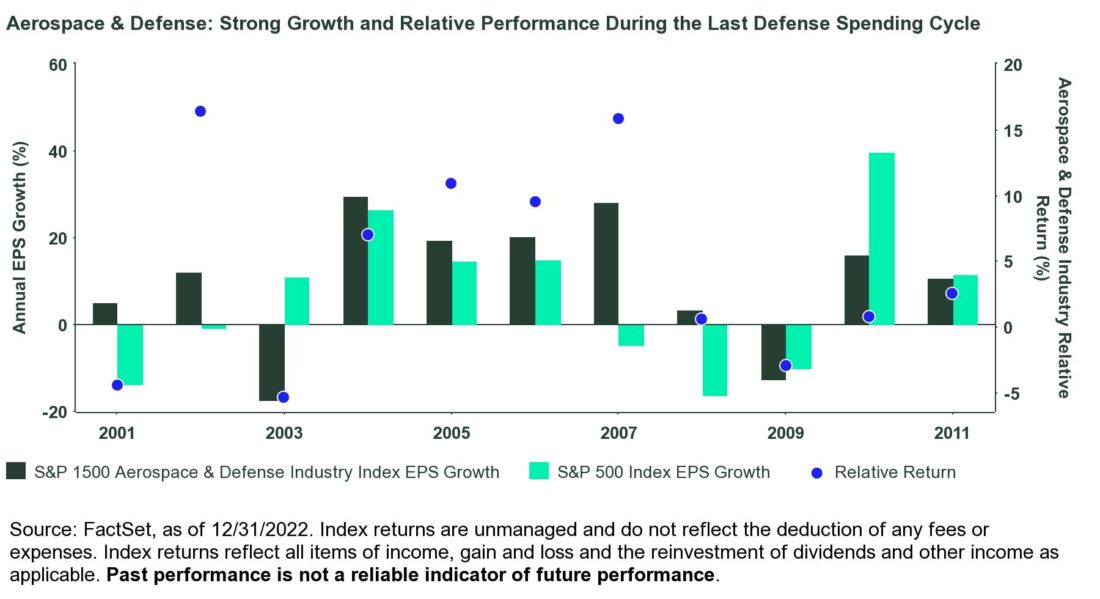
During the last defense spending cycle between 2001 and 2011, the US economy experienced two economic recessions. Supported by the secular increase in defense spending, the aerospace & defense industry showed greater resilience in the challenging economic environment, posting stronger growth than the broad market for most years and outperforming 39% over the broad market on a cumulative basis over the same period.6 See the chart below. Similar growth trends are expected for 2023 amid higher demand. Although the industry’s consensus growth estimate for 2023 came down in the second half of 2022, it is still significantly higher than the broad market (46% vs 4%).7
While the aerospace & defense industry appears expensive based on price-to-forward-earnings following its strong performance last year, its price-to-book ratio is around its 20-year average.8 Relative to the broad market, its price-to-book ratio is at the bottom quintile of the past 20 years and 15% below the median level during the last defense spending cycle, indicating an underappreciated growth opportunity.9
Regional Banks
US banks posted negative earnings growth for 2022 largely due to the base effect from significant reserve releases in 2021. However, they entered 2023 with record net interest income, higher net interest margin, strong loan growth, and favorable asset quality, thanks to rising interest rates and resilient consumer and business activities. Against the backdrop of the Fed’s aggressive rate hikes, the bank industry saw the largest year-over-year expansion in net interest margin on record in Q3,10 since the yields on bank assets are more sensitive to higher interest rates than the yields on deposit. Meanwhile, supported by strong growth across a wide range of loan portfolios, banks’ total loan balance grew 9.9% on a trailing 12-month basis — the fastest rate since Q2 2006.
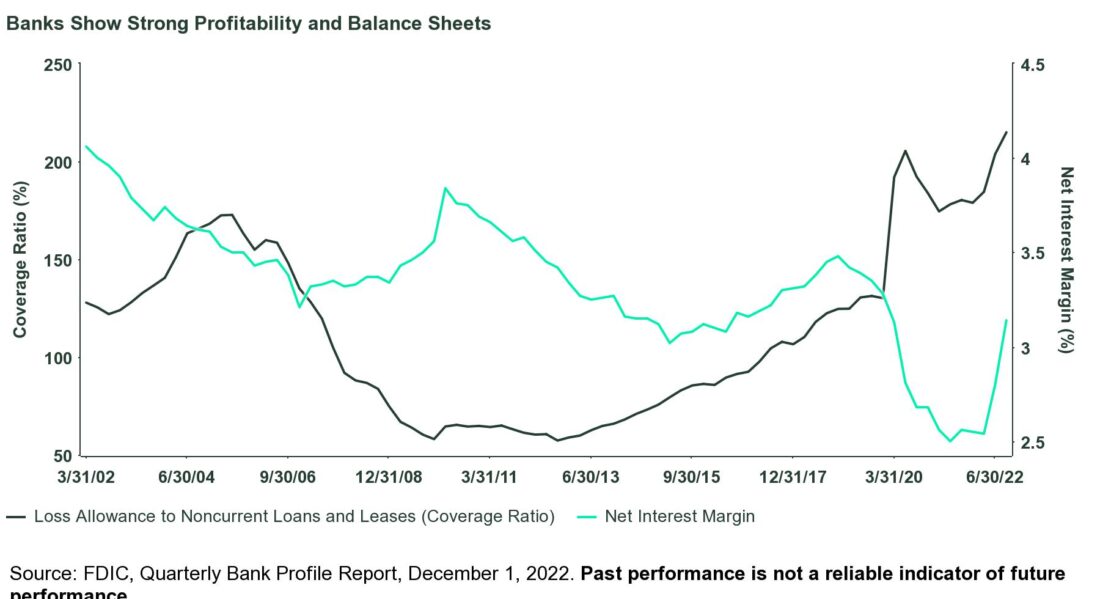
Strong loan growth has not come at the expense of asset quality, as early delinquencies (loans past due 30-89 days) and net charge-off rates hover around historical lows. Given higher economic uncertainty, banks have set aside more reserves to prepare for potential losses, resulting in the highest reserve coverage ratio on record.11
With monetary tightening working its way to the broader economy, we acknowledge that loan growth probably peaked in 2022 and net charge-off rates may start normalizing from post-pandemic lows in a slow growth environment. Nevertheless, given that the yields on banks’ earning assets are still well below their pre-pandemic level when the interest rate was much lower than the current level, and the likelihood of more rate hikes this year, we may see more upside on the net interest margin, supporting earnings growth in the bank industry for 2023.12 As a result, the industry’s recent earnings outlook has been more stable than the broad market and other cyclical sectors , with less significant earnings downgrades for 2023.13
Despite the industry’s solid fundamentals, it is trading at a 41% and 64% discount to the broad market based on forward price-to-earnings and price-to-book multiples, respectively.14 These relative valuations are within the bottom quintile over the past 15 years and close to their levels during the peak of the Global Financial Crisis, indicating the market is pricing in a deep recession for the industry. Given the industry’s strong balance sheet and favorable interest rate environment, its current valuations may provide investors an attractive value opportunity with more potential for upside surprises under a soft landing scenario.
Click here to read the full article
Footnotes
1 FactSet, as of December 31, 2022. The aerospace & defense industry is represented by the S&P 1500 Aerospace & Defense Industry.
2 FactSet, as of December 31, 2022. The aerospace & defense industry is represented by the S&P 1500 Aerospace & Defense Industry.
3 Department of Defense, National Defense Strategy, December 31, 2022.
4 CNN, Here’s what’s in the $858 billion defense bill, December 15, 2022.
5 National Defense Strategy, US Department of Defense
6 FactSet, as of 12/31/2022. For the period between 12/31/2000 and 12/31/2011
7 FactSet, as of 12/31/2022.
8 FactSet, as of 12/31/2022.
9 FactSet, as of 12/31/2022.
10 FDIC, Quarterly Bank Profile Report, December 1, 2022
11 FDIC, Quarterly Bank Profile Report, December 1, 2022
12 FactSet, S&P 500, S&P 1500 Bank Industry. 1/12/2022.
13 FactSet, as of 12/31/2022
14 Industry valuations are calculated using the S&P Regional Bank Select Industry Index.
15 Bloomberg Finance L.P., State Street Global Advisors, as of 12/31/2022.
16 FactSet, as of 12/31/2022.
17 FactSet, as of 12/31/2022. S&P 500 Health Care Sector Index
18 FactSet, as of 12/31/2022.
19 FactSet, as of 12/31/2022.
—
Originally Posted January 30, 2023 – Sector Opportunities for Q1 2023
Disclosure
The views expressed in this material are the views of the SPDR Research and Strategy team through the period ended January 21, 2023, and are subject to change based on market and other conditions. This document contains certain statements that may be deemed forward-looking statements. Please note that any such statements are not guarantees of any future performance and actual results or developments may differ materially from those projected.
The information provided does not constitute investment advice and it should not be relied on as such. It should not be considered a solicitation to buy or an offer to sell a security. It does not take into account any investor’s particular investment objectives, strategies, tax status or investment horizon. You should consult your tax and financial advisor.
All information is from SSGA unless otherwise noted and has been obtained from sources believed to be reliable, but its accuracy is not guaranteed. There is no representation or warranty as to the current accuracy, reliability or completeness of, nor liability for, decisions based on such information and it should not be relied on as such.
Investing involves risk including the risk of loss of principal.
Equity securities may fluctuate in value and can decline significantly in response to the activities of individual companies and general market and economic conditions.
Because of their narrow focus, sector investing tends to be more volatile than investments that diversify across many sectors and companies.
While the shares of ETFs are tradable on secondary markets, they may not readily trade in all market conditions and may trade at significant discounts in periods of market stress.
Non-diversified funds that focus on a relatively small number of securities tend to be more volatile than diversified funds and the market as a whole.
Concentrated investments in a particular sector or industry tend to be more volatile than the overall market and increases risk that events negatively affecting such sectors or industries could reduce returns, potentially causing the value of the Fund’s shares to decrease.
Passively managed funds invest by sampling the Index, holding a range of securities that, in the aggregate, approximates the full Index in terms of key risk factors and other characteristics. This may cause the fund to experience tracking errors relative to performance of the Index.
The whole or any part of this work may not be reproduced, copied or transmitted or any of its contents disclosed to third parties without SSGA’s express written consent.
Dow Jones and Dow Jones Total Stock Market Indexes are service marks of Dow Jones & Company, Inc. and have been licensed for use for certain purposes by State Street Bank and Trust. SPDR ETFs based on the Dow Jones Indexes, are not sponsored, endorsed, sold or promoted by Dow Jones and Dow Jones makes no representation regarding the advisability of investing in such product(s).
The trademarks and service marks referenced herein are the property of their respective owners. Third party data providers make no warranties or representations of any kind relating to the accuracy, completeness or timeliness of the data and have no liability for damages of any kind relating to the use of such data.
Disclosure: State Street Global Advisors
Do not reproduce or reprint without the written permission of SSGA.
All information has been obtained from sources believed to be reliable, but its accuracy is not guaranteed. There is no representation or warranty as to the current accuracy, reliability or completeness of, nor liability for, decisions based on such information and it should not be relied on as such.
State Street Global Advisors and its affiliates (“SSGA”) have not taken into consideration the circumstances of any particular investor in producing this material and are not making an investment recommendation or acting in fiduciary capacity in connection with the provision of the information contained herein.
ETFs trade like stocks, are subject to investment risk, fluctuate in market value and may trade at prices above or below the ETF’s net asset value. Brokerage commissions and ETF expenses will reduce returns.
Bonds generally present less short-term risk and volatility than stocks, but contain interest rate risk (as interest rates raise, bond prices usually fall); issuer default risk; issuer credit risk; liquidity risk; and inflation risk. These effects are usually pronounced for longer-term securities. Any fixed income security sold or redeemed prior to maturity may be subject to a substantial gain or loss.
Investing involves risk including the risk of loss of principal.
The whole or any part of this work may not be reproduced, copied or transmitted or any of its contents disclosed to third parties without SSGA’s express written consent.
Investing in high yield fixed income securities, otherwise known as “junk bonds”, is considered speculative and involves greater risk of loss of principal and interest than investing in investment grade fixed income securities. These Lower-quality debt securities involve greater risk of default or price changes due to potential changes in the credit quality of the issuer.
COPYRIGHT AND OTHER RIGHTS
Other third party content is the intellectual property of the respective third party and all rights are reserved to them. All rights reserved. No organization or individual is permitted to reproduce, distribute or otherwise use the statistics and information in this report without the written agreement of the copyright owners.
Definition:
Arbitrage: the simultaneous buying and selling of securities, currency, or commodities in different markets or in derivative forms in order to take advantage of differing prices for the same asset.
Fund Objectives:
SPY: The investment seeks to provide investment results that, before expenses, correspond generally to the price and yield performance of the S&P 500® Index. The Trust seeks to achieve its investment objective by holding a portfolio of the common stocks that are included in the index (the “Portfolio”), with the weight of each stock in the Portfolio substantially corresponding to the weight of such stock in the index.
VOO: The investment seeks to track the performance of a benchmark index that measures the investment return of large-capitalization stocks. The fund employs an indexing investment approach designed to track the performance of the Standard & Poor’s 500 Index, a widely recognized benchmark of U.S. stock market performance that is dominated by the stocks of large U.S. companies. The advisor attempts to replicate the target index by investing all, or substantially all, of its assets in the stocks that make up the index, holding each stock in approximately the same proportion as its weighting in the index.
IVV: The investment seeks to track the investment results of the S&P 500 (the “underlying index”), which measures the performance of the large-capitalization sector of the U.S. equity market. The fund generally invests at least 90% of its assets in securities of the underlying index and in depositary receipts representing securities of the underlying index. It may invest the remainder of its assets in certain futures, options and swap contracts, cash and cash equivalents, as well as in securities not included in the underlying index, but which the advisor believes will help the fund track the underlying index.
The funds presented herein have different investment objectives, costs and expenses. Each fund is managed by a different investment firm, and the performance of each fund will necessarily depend on the ability of their respective managers to select portfolio investments. These differences, among others, may result in significant disparity in the funds’ portfolio assets and performance. For further information on the funds, please review their respective prospectuses.
Entity Disclosures:
The trademarks and service marks referenced herein are the property of their respective owners. Third party data providers make no warranties or representations of any kind relating to the accuracy, completeness or timeliness of the data and have no liability for damages of any kind relating to the use of such data.
SSGA Funds Management, Inc. serves as the investment advisor to the SPDR ETFs that are registered with the United States Securities and Exchange Commission under the Investment Company Act of 1940. SSGA Funds Management, Inc. is an affiliate of State Street Global Advisors Limited.
Intellectual Property Disclosures:
Standard & Poor’s®, S&P® and SPDR® are registered trademarks of Standard & Poor’s® Financial Services LLC (S&P); Dow Jones is a registered trademark of Dow Jones Trademark Holdings LLC (Dow Jones); and these trademarks have been licensed for use by S&P Dow Jones Indices LLC (SPDJI) and sublicensed for certain purposes by State Street Corporation. State Street Corporation’s financial products are not sponsored, endorsed, sold or promoted by SPDJI, Dow Jones, S&P, their respective affiliates and third party licensors and none of such parties make any representation regarding the advisability of investing in such product(s) nor do they have any liability in relation thereto, including for any errors, omissions, or interruptions of any index.
BLOOMBERG®, a trademark and service mark of Bloomberg Finance, L.P. and its affiliates, and BARCLAYS®, a trademark and service mark of Barclays Bank Plc., have each been licensed for use in connection with the listing and trading of the SPDR Bloomberg Barclays ETFs.
Distributor: State Street Global Advisors Funds Distributors, LLC, member FINRA, SIPC, an indirect wholly owned subsidiary of State Street Corporation. References to State Street may include State Street Corporation and its affiliates. Certain State Street affiliates provide services and receive fees from the SPDR ETFs.
ALPS Distributors, Inc., member FINRA, is distributor for SPDR® S&P 500®, SPDR® S&P MidCap 400® and SPDR® Dow Jones Industrial Average, all unit investment trusts. ALPS Distributors, Inc. is not affiliated with State Street Global Advisors Funds Distributors, LLC.
Before investing, consider the funds’ investment objectives, risks, charges, and expenses. For SPDR funds, you may obtain a prospectus or summary prospectus containing this and other information by calling 1‐866‐787‐2257 or visiting www.spdrs.com. Please read the prospectus carefully before investing.
Disclosure: Interactive Brokers
Information posted on IBKR Campus that is provided by third-parties does NOT constitute a recommendation that you should contract for the services of that third party. Third-party participants who contribute to IBKR Campus are independent of Interactive Brokers and Interactive Brokers does not make any representations or warranties concerning the services offered, their past or future performance, or the accuracy of the information provided by the third party. Past performance is no guarantee of future results.
This material is from State Street Global Advisors and is being posted with its permission. The views expressed in this material are solely those of the author and/or State Street Global Advisors and Interactive Brokers is not endorsing or recommending any investment or trading discussed in the material. This material is not and should not be construed as an offer to buy or sell any security. It should not be construed as research or investment advice or a recommendation to buy, sell or hold any security or commodity. This material does not and is not intended to take into account the particular financial conditions, investment objectives or requirements of individual customers. Before acting on this material, you should consider whether it is suitable for your particular circumstances and, as necessary, seek professional advice.


