


Investors have often used gold tactically in their portfolios, with an aim to help preserve wealth with a relatively liquid asset that can potentially help navigate risk during market corrections, geopolitical stress or persistent dollar weakness. But in addition to gold’s tactical benefits, its function as a core diversifying asset during a variety of business cycles may demonstrate that gold can potentially play a more long-term strategic role.
Gold has the potential to enhance portfolio construction strategies on several fronts — providing broad benefits that can potentially support strategic investment efforts across multiple business cycles. Primary potential benefits include:
- Risk Management
- Capital Appreciation
- Wealth Preservation
Here we show how the key pillars and historical benefits of gold investing can provide potential support for these vital elements of investors’ portfolios.
1. Gold and Risk Management: The Potential Short-term and Strategic Benefits
Managing risks — both short term and unknown — is critical to optimizing portfolio performance. And gold’s historical benefits during a variety of market and business cycles can potentially provide a ballast for portfolios during good times and bad.
Portfolio Diversification
Gold has demonstrated a low and negative historical correlation to many financial indices over time, potentially helping to smooth out volatility and preserve wealth. For example, gold has shown a 0.01 and 0.09 monthly correlation to the S&P 500 Index and Bloomberg US Aggregate Bond Index, respectively, since the 1970s.1 This persistent and historically low correlation to many other financial assets is rooted in gold’s diverse sources of demand — both cyclical and countercyclical — which is illustrated during different phases of a full economic cycle.
Adding an allocation to gold may potentially provide diversification that can help mitigate portfolio drawdowns, increase portfolio efficiency through higher Sharpe Ratios and provide a potential store of value for investors over time.
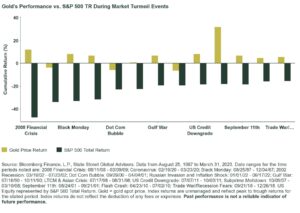
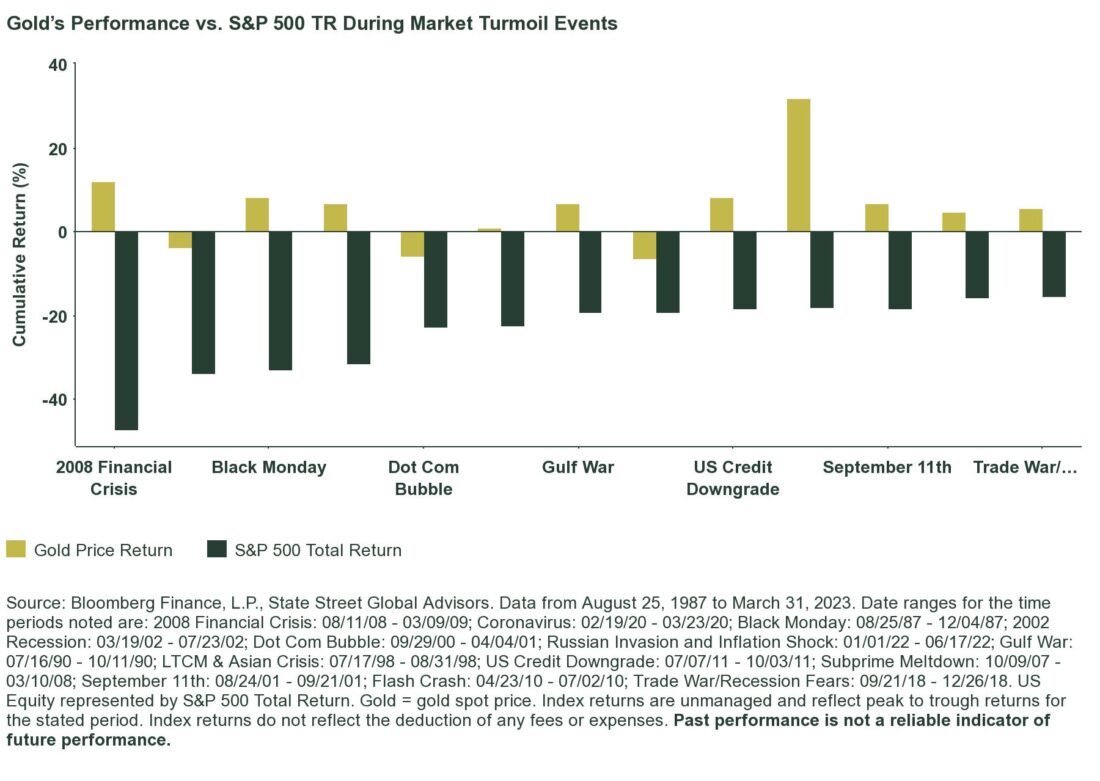
Managing Market Downturns
With a reputation as a perceived safe-haven asset,2 gold’s performance has the potential to shine during extreme volatility and market turbulence, growing less correlated to traditional equities and providing a potential ballast for portfolios that can help limit drawdowns.
As 2020 transformed asset markets, investors were faced with constructing portfolios that can weather the low interest rate and risk landscape. Gold’s historic benefits may potentially provide advantages to the modern-day portfolio that can help investors navigate these evolving risks.
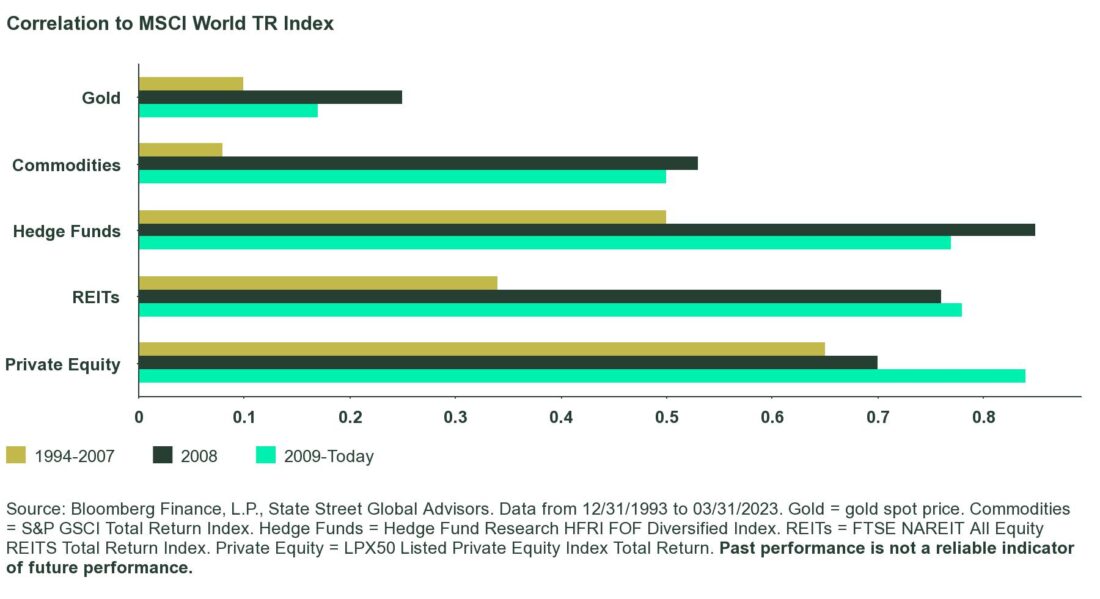
Low Correlation to Other Assets and Alternatives
Based on gold’s low correlation to many traditional markets, gold has historically provided positive returns during extreme bouts of volatility and market turmoil — earning it a “perceived safe-haven” reputation with some investors.
Unlike several other asset classes typically used as portfolio diversifiers, gold has historically been an efficient source of portfolio diversification, with its low correlation historically growing stronger over time, while many real assets have moved in an opposite direction,3 more closely aligning with movements of traditional equities and bonds.
2. Capital Appreciation and Gold’s Potential
Gold may merit consideration in more than just down markets, with its benefits potentially providing investors longer-term and strategic opportunities in terms of capital appreciation. Gold’s diversification and historically uncorrelated returns can potentially help limit episodes of portfolio drawdown, and that can help optimize portfolios by limiting impairments to capital. But gold is not just for managing the downside and may provide the potential opportunity to help investors grow their capital during certain market cycles, with some growth potential of its own.
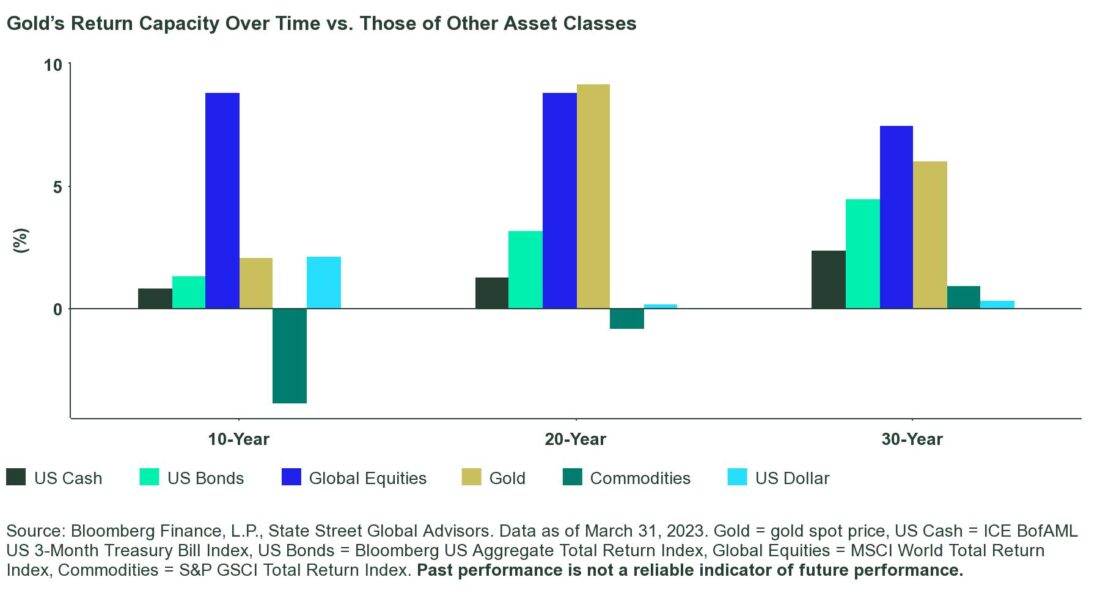
Historical Long-Term Returns
Gold has historically provided competitive long-term returns through a variety of business cycles — good and bad — adding longer-term diversification that can potentially help with optimizing portfolio returns.
Click here to read the full article
Footnote
1Bloomberg Finance, L.P., & State Street Global Advisors; LBMA Gold Price PM ($/oz) has demonstrated a 0.00 and 0.08 monthly correlation to the S&P 500 Index and Bloomberg US Aggregate Bond Index, respectively. S&P 500 correlation is from 8/31/1971 to 03/31/2023 and Bloomberg US Aggregate Bond Index correlation is from 3/31/1976 to 03/31/2023 due to data availability. The correlation coefficient measures the strength and direction of a linear relationship between two variables. It measures the degree to which the deviation of one variable from its mean is related to that of a different variable from its respective mean, with 0 being uncorrelated and 1 being perfectly correlated.
2Assets may be considered “safe havens” based on investor perception that an asset’s value will hold steady or climb even as the value of other investments drops during times of economic stress. Perceived safe-haven assets are not guaranteed to maintain value at any time.
3Bloomberg Finance, L.P., State Street Global Advisors. Data from 12/31/93 to 03/31/2023. Gold = gold spot price. Commodities = S&P GSCI Total Return Index, REITs = FTSE NAREIT All Equity REITS Total Return Index. Past performance is not a reliable indicator of future performance.
4World Gold Council, Bloomberg, Bank for International Settlements, London Bullion Market Association. Data as of December 31, 2022. Estimates based on clearing statistics published by the LBMA, LBMA-i and non-LBMA-i OT (estimates represent daily averages in US$ billion for Q2’2020), COMEX, SHFE, SGE, LME precious, Dubai Gold & Commodities Exchange, ICE Futures, US Metals, Borsa Istanbul, Bursa Malaysia, Moscow Exchange, and Tokyo Commodity Exchange.
5Bloomberg Finance L.P., & State Street Global Advisors. Gold has increased by an average annual rate of 10.6% when price inflation has been running above 5% per year from August 31, 1971 to March 31, 2023.
6Bloomberg Finance L.P., & State Street Global Advisors. LBMA Gold Price PM ($/oz) has demonstrated a -0.39 monthly correlation to the US Dollar Index from August 31, 1971 to March 31, 2023.
Glossary
Bloomberg US Aggregate Bond Index
A benchmark that provides a measure of the performance of the U.S. dollar-denominated investment-grade bond market. The “Agg” includes public offerings in the US of investment-grade government bonds, investment-grade corporate bonds, mortgage pass through securities, commercial mortgage backed securities and asset backed securities.
Bloomberg Emerging Markets USD Aggregate Bond TR Index
A flagship hard currency Emerging Markets debt benchmark that includes USD-denominated debt from sovereign, quasi-sovereign, and corporate EM issuers.
Bloomberg Global Aggregate Corporate Bond TR Index
A corporate Index that is a flagship measure of global investment grade, fixed-rate corporate debt. This multi-currency benchmark includes bonds from developed and emerging markets issuers within the industrial, utility and financial sectors.
Bloomberg Global Corporate High Yield Bond TR Index
A multi-currency flagship measure of the global high yield debt market. The index represents the union of the US High Yield, the Pan-European High Yield, and Emerging Markets (EM) Hard Currency High Yield Indices. The high yield and emerging markets sub-components are mutually exclusive.
Bloomberg Global Aggregate Government Bond Index TR
A government index that is a measure of investment grade rated debt from 25 local currency markets. This multi-currency benchmark includes Treasury and government-related fixed-rate bonds from both developed and emerging markets issuers.
Bloomberg World Inflation-Linked Bond TR Index
Measures the investment-grade, government inflation-linked debt from 12 different developed market countries. Investability is a key criterion for inclusion of markets in this index, and it is designed to include only those markets in which a global government linker fund is likely and able to invest.
Bloomberg Commodity Index TR
A broadly diversified commodity price index distributed by Bloomberg Indexes that tracks 22 commodity futures and seven sectors. No one commodity can compose less than 2 percent or more than 15 percent of the index, and no sector can represent more than 33 percent of the index.
Commodities
A basic good used in commerce that is interchangeable, or “fungible,” with other commodities of the same type. Commodities are most often used as inputs in the production of other goods or services. For example, crude oil is a commodity that is used to make motor fuels, heating oil and lubricants.
Correlation
The historical tendency of two investments to move together. Investors often combine investments with low correlations to diversify portfolios.
Correlation Coefficient
The correlation coefficient measures the strength and direction of a linear relationship between two variables. It measures the degree to which the deviations of one variable from its mean are related to those of a different variable from its respective mean.
Currency Depreciation
The decline of a currency’s value relative to another currency.
Diversification
A strategy of combining a broad mix of investments and asset classes to potentially limit risk, although diversification does not guarantee protection against a loss in falling markets.
Diversification benefits
In modern portfolio theory, diversification is an approach used to potentially reduce the overall risk of the portfolio by holding a mix of assets with low correlations to each other. The potential benefit of holding uncorrelated assets is that some investments may rise while others fall.
Downside Risk
A given security’s potential to lose value if a prevailing market trend suddenly changes. The term also refers to the specific financial amount of the “worst-case” loss that that can occur in such sudden shifts.
Drawdown
A specific decline in the stock market during a specific time period that is measured in percentage terms as a peak-to-trough move.
Drawdown Protection
Investments that could help insulate an overall portfolio from a decline in stocks or other financial markets. Examples include cash or other investments that have historically held up relatively well in down or volatile markets, such as gold or equity put options.
Economic Cycle
Periods of growth or contraction in the economy, typically called periods of expansion or recession. Different sectors and industries typically perform differently based on particular phases of the economic cycle.
FTSE NAREIT All Equity REITS Index
The index is a free-float-adjusted market capitalization-weighted index that includes all tax-qualified REITs listed in the NYSE, AMEX, and NASDAQ National Market.
Global Property Research General Index
A broad-based global real estate benchmark that contains all listed real estate companies that conform to General Property Research’s index-qualification rules, bringing the number of index constituents to more than 650. The index’s inception date was Dec. 31, 1983.
HFRI FOF Diversified Index
The index invests in a variety of strategies among multiple managers; historical annual returns and/or standard deviations are generally similar to those of the HFRI Fund of Fund Composite Index. A fund in the HFRI FOF Diversified Index tends to show minimal loss in down markets while achieving superior returns in up markets.
Hypothetical Blended Portfolio Performance Methodology
The hypothetical example is for illustrative purposes only and past performance is not a guarantee of future results.
Returns shown in the example do not represent those of a fund but were achieved by mathematically combining the actual performance data of MSCI AC World Daily TR Index, Bloomberg Global Aggregate Government Bond Index, Bloomberg Aggregate Global Corporate Bond Index, Bloomberg Emerging Markets Debt Index, Global Property Research General Index, S&P Listed Private Equity Index, Bloomberg World Inflation Linked Bond Index, Bloomberg Global Corporate High Yield Index, S&P GSCI Index, and SPDR® Gold Shares (GLD®) between January 1, 2005 and the current period noted. Each portfolio is rebalanced at the beginning of each year to maintain target portfolio weights. The performance assumes no transaction and rebalancing costs, so actual results will differ. It is not possible to invest directly in an index. Performance of GLD reflects annual expense ratio of 0.40%. The impact of adding GLD to an investor’s portfolio will vary based upon an investor’s asset allocation decisions and market performance, among other things.
ICE BofAML US 3-Month Treasury Bill Index
This is an unmanaged index that is comprised of a single U.S. Treasury issue with approximately three months to final maturity, purchased at the beginning of each month and held for one full month.
Inflation
An overall increase in the price of an economy’s goods and services during a given period, translating to a loss in purchasing power per unit of currency. Inflation generally occurs when growth of the money supply outpaces growth of the economy. Central banks attempt to limit inflation — and avoid deflation — in order to keep the economy running smoothly.
Liquidity
The ability to quickly buy or sell an investment in the market without impacting its price. Trading volume is a primary determinant of liquidity.
LBMA Gold Price The LBMA Gold Price is determined twice each business day — 10:30 a.m. London time (i.e., the LBMA Gold Price AM) and 3:00 p.m. London time (i.e., the LBMA Gold Price PM) by the participants in a physically settled, electronic and tradable auction.
LPX 50 Listed Private Equity Index
The index is designed to represent the global performance of the 50 most highly capitalized and liquid listed private equity companies. The index is diversified across regions, private equity investment styles, financing styles and vintages. The reference currency of the LPX50 Index is EUR, CHF and USD. The index is available as a Price Index and Total Return (Net).
MSCI World Index
The index captures large- and mid-cap representation across 23 Developed Markets. With 1,644 constituents, the index covers approximately 85% of the free float-adjusted market capitalization in each country.
Real Assets
Physical or tangible assets that have value and often are investable. Real assets include precious metals, commodities, real estate, agricultural land and oil; their inclusion in most diversified portfolios is considered appropriate.
Risk-Adjusted Return
A risk-based profitability measurement framework for analyzing risk-adjusted financial performance; it is designed to provide a consistent view of profitability across different assets.
Sharpe Ratio
A measure for calculating risk-adjusted returns that has become the industry standard for such calculations. It was developed by Nobel laureate William F. Sharpe. The Sharpe ratio is the average return earned in excess of the risk-free rate per unit of volatility or total risk. The higher the Sharpe ratio, the better.
Spot Gold Price
The price in spot markets for gold. In US dollar terms, spot gold is referred to with the symbol “XAU,” which refers to the price of one troy ounce of gold in USD terms.
S&P GSCI Total Return Index
The S&P GSCI Total Return Index in USD is widely recognized as the leading measure of general commodity price movements and inflation in the world economy. The index is calculated primarily on a world production-weighted basis comprised of the principal physical commodities futures contracts.
S&P 500® Total Return Index
The version of the popular benchmark for U.S. large-cap equities that includes 500 companies from leading industries and captures about 80% coverage of available market capitalization in the US that reflects returns after reinvestment of dividends.
US Dollar Index / US Dollar Index (DXY)
A currency benchmark that measures the performance of the US dollar against a basket of currencies: the euro (EUR), the yen (JPY), the British pound (GBP), the Canadian dollar (CAD), the Swiss franc (CHF) and the Swedish krona (SEK). Its shorthand symbol in financial markets is “DXY.”
Volatility
The tendency of a market index or security to jump
—
Originally Posted April 28, 2023 – Gold as a Strategic Asset Class
Disclosures
Information Classification: General Access
Important Risk Information
Investing involves risk including the risk of loss of principal.
This communication is not intended to be an investment recommendation or investment advice and should not be relied upon as such.
The whole or any part of this work may not be reproduced, copied or transmitted or any of its contents disclosed to third parties without SSGA’s express written consent.
All information is from SSGA unless otherwise noted and has been obtained from sources believed to be reliable, but its accuracy is not guaranteed. There is no representation or warranty as to the current accuracy, reliability or completeness of, nor liability for, decisions based on such information and it should not be relied on as such.
Frequent trading of ETFs could significantly increase commissions and other costs such that they may offset any savings from low fees or costs.
Diversification does not ensure a profit or guarantee against loss.
The trademarks and service marks referenced herein are the property of their respective owners. Third party data providers make no warranties or representations of any kind relating to the accuracy, completeness or timeliness of the data and have no liability for damages of any kind relating to the use of such data.
Investing involves risk, and you could lose money on an investment in each of SPDR® Gold Shares Trust (“GLD®” or “GLD”) and SPDR® Gold MiniShares® Trust (“GLDM®” or “GLDM”), a series of the World Gold Trust (together, the “Funds”).
Commodities and commodity-index linked securities may be affected by changes in overall market movements, changes in interest rates, and other factors such as weather, disease, embargoes, or political and regulatory developments, as well as trading activity of speculators and arbitrageurs in the underlying commodities.
Investing in commodities entails significant risk and is not appropriate for all investors.
Important Information Relating to GLD® and GLDM®:
GLD and the World Gold Trust have each filed a registration statement (including a prospectus) with the Securities and Exchange Commission (“SEC”) for GLD and GLDM, respectively. Before you invest, you should read the prospectus in the registration statement and other documents each Fund has filed with the SEC for more complete information about each Fund and these offerings. Please see each Fund’s prospectus for a detailed discussion of the risks of investing in each Fund’s shares. The GLD prospectus is available by clicking here, and the GLDM prospectus is available by clicking here. You may get these documents for free by visiting EDGAR on the SEC website at sec.gov or by visiting spdrgoldshares.com. Alternatively, the Funds or any authorized participant will arrange to send you the prospectus if you request it by calling 866.320.4053.
None of the Funds is an investment company registered under the Investment Company Act of 1940 (the “1940 Act”). As a result, shareholders of each Fund do not have the protections associated with ownership of shares in an investment company registered under the 1940 Act. GLD and GLDM are not subject to regulation under the Commodity Exchange Act of 1936 (the “CEA”). As a result, shareholders of each of GLD and GLDM do not have the protections afforded by the CEA.
Shares of each Fund trade like stocks, are subject to investment risk and will fluctuate in market value.
The values of GLD shares and GLDM shares relate directly to the value of the gold held by each Fund (less its expenses), respectively. Fluctuations in the price of gold could materially and adversely affect an investment in the shares. The price received upon the sale of the shares, which trade at market price, may be more or less than the value of the gold represented by them.
None of the Funds generate any income, and as each Fund regularly sells gold to pay for its ongoing expenses, the amount of gold represented by each Fund share will decline over time to that extent.
The World Gold Council name and logo are a registered trademark and used with the permission of the World Gold Council pursuant to a license agreement. The World Gold Council is not responsible for the content of, and is not liable for the use of or reliance on, this material. World Gold Council is an affiliate of the Sponsor of each of GLD and GLDM.
MiniShares® is a registered trademark of WGC USA Asset Management Company, LLC used with the permission of WGC USA Asset Management Company, LLC. GLD® and GLDM® are registered trademarks of World Gold Trust Services, LLC used with the permission of World Gold Trust Services, LLC.
For more information, please contact the Marketing Agent for GLD and GLDM: State Street Global Advisors Funds Distributors, LLC, One Iron Street, Boston, MA, 02210; T: +1 866 320 4053 spdrgoldshares.com
Disclosure: State Street Global Advisors
Do not reproduce or reprint without the written permission of SSGA.
All information has been obtained from sources believed to be reliable, but its accuracy is not guaranteed. There is no representation or warranty as to the current accuracy, reliability or completeness of, nor liability for, decisions based on such information and it should not be relied on as such.
State Street Global Advisors and its affiliates (“SSGA”) have not taken into consideration the circumstances of any particular investor in producing this material and are not making an investment recommendation or acting in fiduciary capacity in connection with the provision of the information contained herein.
ETFs trade like stocks, are subject to investment risk, fluctuate in market value and may trade at prices above or below the ETF’s net asset value. Brokerage commissions and ETF expenses will reduce returns.
Bonds generally present less short-term risk and volatility than stocks, but contain interest rate risk (as interest rates raise, bond prices usually fall); issuer default risk; issuer credit risk; liquidity risk; and inflation risk. These effects are usually pronounced for longer-term securities. Any fixed income security sold or redeemed prior to maturity may be subject to a substantial gain or loss.
Investing involves risk including the risk of loss of principal.
The whole or any part of this work may not be reproduced, copied or transmitted or any of its contents disclosed to third parties without SSGA’s express written consent.
Investing in high yield fixed income securities, otherwise known as “junk bonds”, is considered speculative and involves greater risk of loss of principal and interest than investing in investment grade fixed income securities. These Lower-quality debt securities involve greater risk of default or price changes due to potential changes in the credit quality of the issuer.
COPYRIGHT AND OTHER RIGHTS
Other third party content is the intellectual property of the respective third party and all rights are reserved to them. All rights reserved. No organization or individual is permitted to reproduce, distribute or otherwise use the statistics and information in this report without the written agreement of the copyright owners.
Definition:
Arbitrage: the simultaneous buying and selling of securities, currency, or commodities in different markets or in derivative forms in order to take advantage of differing prices for the same asset.
Fund Objectives:
SPY: The investment seeks to provide investment results that, before expenses, correspond generally to the price and yield performance of the S&P 500® Index. The Trust seeks to achieve its investment objective by holding a portfolio of the common stocks that are included in the index (the “Portfolio”), with the weight of each stock in the Portfolio substantially corresponding to the weight of such stock in the index.
VOO: The investment seeks to track the performance of a benchmark index that measures the investment return of large-capitalization stocks. The fund employs an indexing investment approach designed to track the performance of the Standard & Poor’s 500 Index, a widely recognized benchmark of U.S. stock market performance that is dominated by the stocks of large U.S. companies. The advisor attempts to replicate the target index by investing all, or substantially all, of its assets in the stocks that make up the index, holding each stock in approximately the same proportion as its weighting in the index.
IVV: The investment seeks to track the investment results of the S&P 500 (the “underlying index”), which measures the performance of the large-capitalization sector of the U.S. equity market. The fund generally invests at least 90% of its assets in securities of the underlying index and in depositary receipts representing securities of the underlying index. It may invest the remainder of its assets in certain futures, options and swap contracts, cash and cash equivalents, as well as in securities not included in the underlying index, but which the advisor believes will help the fund track the underlying index.
The funds presented herein have different investment objectives, costs and expenses. Each fund is managed by a different investment firm, and the performance of each fund will necessarily depend on the ability of their respective managers to select portfolio investments. These differences, among others, may result in significant disparity in the funds’ portfolio assets and performance. For further information on the funds, please review their respective prospectuses.
Entity Disclosures:
The trademarks and service marks referenced herein are the property of their respective owners. Third party data providers make no warranties or representations of any kind relating to the accuracy, completeness or timeliness of the data and have no liability for damages of any kind relating to the use of such data.
SSGA Funds Management, Inc. serves as the investment advisor to the SPDR ETFs that are registered with the United States Securities and Exchange Commission under the Investment Company Act of 1940. SSGA Funds Management, Inc. is an affiliate of State Street Global Advisors Limited.
Intellectual Property Disclosures:
Standard & Poor’s®, S&P® and SPDR® are registered trademarks of Standard & Poor’s® Financial Services LLC (S&P); Dow Jones is a registered trademark of Dow Jones Trademark Holdings LLC (Dow Jones); and these trademarks have been licensed for use by S&P Dow Jones Indices LLC (SPDJI) and sublicensed for certain purposes by State Street Corporation. State Street Corporation’s financial products are not sponsored, endorsed, sold or promoted by SPDJI, Dow Jones, S&P, their respective affiliates and third party licensors and none of such parties make any representation regarding the advisability of investing in such product(s) nor do they have any liability in relation thereto, including for any errors, omissions, or interruptions of any index.
BLOOMBERG®, a trademark and service mark of Bloomberg Finance, L.P. and its affiliates, and BARCLAYS®, a trademark and service mark of Barclays Bank Plc., have each been licensed for use in connection with the listing and trading of the SPDR Bloomberg Barclays ETFs.
Distributor: State Street Global Advisors Funds Distributors, LLC, member FINRA, SIPC, an indirect wholly owned subsidiary of State Street Corporation. References to State Street may include State Street Corporation and its affiliates. Certain State Street affiliates provide services and receive fees from the SPDR ETFs.
ALPS Distributors, Inc., member FINRA, is distributor for SPDR® S&P 500®, SPDR® S&P MidCap 400® and SPDR® Dow Jones Industrial Average, all unit investment trusts. ALPS Distributors, Inc. is not affiliated with State Street Global Advisors Funds Distributors, LLC.
Before investing, consider the funds’ investment objectives, risks, charges, and expenses. For SPDR funds, you may obtain a prospectus or summary prospectus containing this and other information by calling 1‐866‐787‐2257 or visiting www.spdrs.com. Please read the prospectus carefully before investing.
Disclosure: Interactive Brokers
Information posted on IBKR Campus that is provided by third-parties does NOT constitute a recommendation that you should contract for the services of that third party. Third-party participants who contribute to IBKR Campus are independent of Interactive Brokers and Interactive Brokers does not make any representations or warranties concerning the services offered, their past or future performance, or the accuracy of the information provided by the third party. Past performance is no guarantee of future results.
This material is from State Street Global Advisors and is being posted with its permission. The views expressed in this material are solely those of the author and/or State Street Global Advisors and Interactive Brokers is not endorsing or recommending any investment or trading discussed in the material. This material is not and should not be construed as an offer to buy or sell any security. It should not be construed as research or investment advice or a recommendation to buy, sell or hold any security or commodity. This material does not and is not intended to take into account the particular financial conditions, investment objectives or requirements of individual customers. Before acting on this material, you should consider whether it is suitable for your particular circumstances and, as necessary, seek professional advice.
Disclosure: Futures Trading
Futures are not suitable for all investors. The amount you may lose may be greater than your initial investment. Before trading futures, please read the CFTC Risk Disclosure. A copy and additional information are available at ibkr.com.


Join The Conversation
If you have a general question, it may already be covered in our FAQs. If you have an account-specific question or concern, please reach out to Client Services.