


![[Gamma] Scalping Please](https://ibkrcampus.com/wp-content/smush-webp/2024/04/tir-featured-8-700x394.jpg.webp "[Gamma] Scalping Please")


As the use of sustainability metrics in sovereign fixed income becomes more widespread, there is still a lack of common understanding on how to appropriately apply them to assess countries’ Environmental, Social and Governance (ESG) performance. Recently, attention has been especially drawn to the income bias that is ingrained in sovereign ESG scores.
A key World Bank Study, Demystifying Sovereign ESG, sheds light on how ESG assessment criteria often assess Advanced Economies (AEs) more favourably than Emerging Markets and Developing Economies (EMDEs). This results in sovereign ESG scores and countries’ level of development being highly correlated – and potentially disadvantaging EMDEs access to finance.
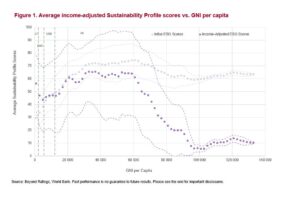
Figure 1 below indeed shows two sets of ESG scores sorted by level of development: initial ESG scores which empirically illustrate the income bias; as well as income adjusted ESG scores.
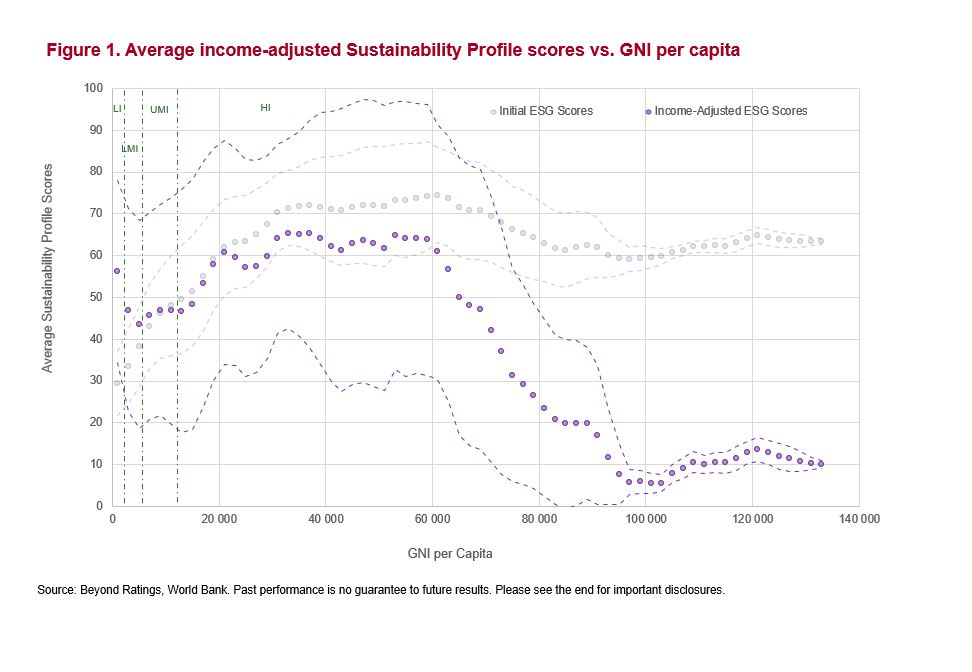
Since income bias can directly impact the real economy and bring unintended consequences (i.e., lower scores can result in higher expected yields – increasing the overall debt burden – or in restricting access to some potential lenders), we first need to observe the current state of play and how countries perform in terms of ESG depending on their level of development. We can distinguish four different groups from initial ESG scores on Figure 1:
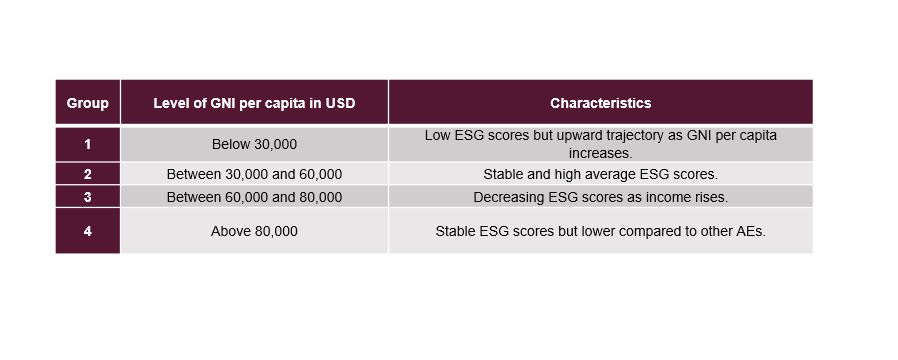
Within these brackets, sovereign ESG scores are quite concentrated, meaning that outliers are not very common, and the differentiation of countries is not that obvious.
Using an ex-post approach and our proprietary Sovereign Risk Monitor (SRM) methodology, we estimate a log-linear relationship between the income level of economies and their respective E, S and G performance assessment. Residuals are then normalized and used as income-adjusted sovereign E, S and G scores, representing the portion of initial E, S, and G scores unexplained by the income level.
What about income-adjusted ESG scores?
Once the income bias is corrected, we can differentiate between ESG performance of sovereigns at similar income levels much more clearly. Indeed, the dispersion around the average is more than twice as large after correcting for income bias. For example, Sweden, Singapore and Qatar – with comparable per capita income levels – appear broadly close for the initial scores (e.g., from 47.5 for Singapore E score to 97.7 for Sweden G score in 2020), but have very mixed income-adjusted E, S and G scores (e.g., from 2.0 for Qatar income-adjusted E score to 93.9 for Sweden income-adjusted E score).
As for the emerging countries of Latin America with comparable per capita income levels, the correction of the income bias highlights a relatively good performance of the E scores (e.g., Colombia, Ecuador and Paraguay gain about 30 points after correcting for income bias to get very high E scores) while the endemic weakness of the G scores seems exacerbated (e.g., these same three countries lose around 10 points to fall to levels between 25 and 40 after the correction). Income-adjusted S scores appear more balanced.
We expand on this in our recent research paper Dealing with income bias in sovereign ESG scores – Sovereign ESG revisited, showing that:
- The income bias is most pronounced for G scores, becoming weaker for S and particularly E scores;
- The existing differences in ESG performance between high-income OECD and non-OECD countries are amplified after adjusting for income bias;
- After removing income bias, low-income economies do score significantly in the E, S and G pillars.
The latter point, in particular, suggests that, despite lower income levels, some of these economies can establish strong adjusted ESG performance, in particular in the S and G pillars, which in turn are important drivers of future economic prosperity for EMDEs.
Please see our paper for more details on applying ESG to government bond indexes. Subscribe to our blog for more insight.
—
Originally Posted September 30, 2022 – Does income bias in sovereign ESG disadvantage poor countries?
Disclosure: FTSE Russell
Interactive Advisors, a division of Interactive Brokers Group, offers FTSE Russell Index Tracker portfolios on its online investing marketplace. Learn more about the Diversified Portfolios.
This material is not intended as investment advice. Interactive Advisors or portfolio managers on its marketplace may hold long or short positions in the companies mentioned through stocks, options or other securities.
© 2023 London Stock Exchange Group plc and its applicable group undertakings (the “LSE Group”). The LSE Group includes (1) FTSE International Limited (“FTSE”), (2) Frank Russell Company (“Russell”), (3) FTSE Global Debt Capital Markets Inc. and FTSE Global Debt Capital Markets Limited (together, “FTSE Canada”), (4) MTSNext Limited (“MTSNext”), (5) Mergent, Inc. (“Mergent”), (6) FTSE Fixed Income LLC (“FTSE FI”), (7) The Yield Book Inc (“YB”) and (8) Beyond Ratings S.A.S. (“BR”). All rights reserved.
FTSE Russell® is a trading name of FTSE, Russell, FTSE Canada, MTSNext, Mergent, FTSE FI, YB and BR. “FTSE®”, “Russell®”, “FTSE Russell®”, “MTS®”, “FTSE4Good®”, “ICB®”, “Mergent®”, “The Yield Book®”, “Beyond Ratings®“ and all other trademarks and service marks used herein (whether registered or unregistered) are trademarks and/or service marks owned or licensed by the applicable member of the LSE Group or their respective licensors and are owned, or used under licence, by FTSE, Russell, MTSNext, FTSE Canada, Mergent, FTSE FI, YB or BR. FTSE International Limited is authorised and regulated by the Financial Conduct Authority as a benchmark administrator.
All information is provided for information purposes only. All information and data contained in this publication is obtained by the LSE Group, from sources believed by it to be accurate and reliable. Because of the possibility of human and mechanical error as well as other factors, however, such information and data is provided “as is” without warranty of any kind. No member of the LSE Group nor their respective directors, officers, employees, partners or licensors make any claim, prediction, warranty or representation whatsoever, expressly or impliedly, either as to the accuracy, timeliness, completeness, merchantability of any information or of results to be obtained from the use of the FTSE Russell products, including but not limited to indexes, data and analytics or the fitness or suitability of the FTSE Russell products for any particular purpose to which they might be put. Any representation of historical data accessible through FTSE Russell products is provided for information purposes only and is not a reliable indicator of future performance.
No responsibility or liability can be accepted by any member of the LSE Group nor their respective directors, officers, employees, partners or licensors for (a) any loss or damage in whole or in part caused by, resulting from, or relating to any error (negligent or otherwise) or other circumstance involved in procuring, collecting, compiling, interpreting, analysing, editing, transcribing, transmitting, communicating or delivering any such information or data or from use of this document or links to this document or (b) any direct, indirect, special, consequential or incidental damages whatsoever, even if any member of the LSE Group is advised in advance of the possibility of such damages, resulting from the use of, or inability to use, such information.
No member of the LSE Group nor their respective directors, officers, employees, partners or licensors provide investment advice and nothing contained herein or accessible through FTSE Russell products, including statistical data and industry reports, should be taken as constituting financial or investment advice or a financial promotion.
Past performance is no guarantee of future results. Charts and graphs are provided for illustrative purposes only. Index returns shown may not represent the results of the actual trading of investable assets. Certain returns shown may reflect back-tested performance. All performance presented prior to the index inception date is back-tested performance. Back-tested performance is not actual performance, but is hypothetical. The back-test calculations are based on the same methodology that was in effect when the index was officially launched. However, back- tested data may reflect the application of the index methodology with the benefit of hindsight, and the historic calculations of an index may change from month to month based on revisions to the underlying economic data used in the calculation of the index.
This document may contain forward-looking assessments. These are based upon a number of assumptions concerning future conditions that ultimately may prove to be inaccurate. Such forward-looking assessments are subject to risks and uncertainties and may be affected by various factors that may cause actual results to differ materially. No member of the LSE Group nor their licensors assume any duty to and do not undertake to update forward-looking assessments.
No part of this information may be reproduced, stored in a retrieval system or transmitted in any form or by any means, electronic, mechanical, photocopying, recording or otherwise, without prior written permission of the applicable member of the LSE Group. Use and distribution of the LSE Group data requires a licence from FTSE, Russell, FTSE Canada, MTSNext, Mergent, FTSE FI, YB, BR and/or their respective licensors.
Disclosure: Interactive Brokers
Information posted on IBKR Campus that is provided by third-parties does NOT constitute a recommendation that you should contract for the services of that third party. Third-party participants who contribute to IBKR Campus are independent of Interactive Brokers and Interactive Brokers does not make any representations or warranties concerning the services offered, their past or future performance, or the accuracy of the information provided by the third party. Past performance is no guarantee of future results.
This material is from FTSE Russell and is being posted with its permission. The views expressed in this material are solely those of the author and/or FTSE Russell and Interactive Brokers is not endorsing or recommending any investment or trading discussed in the material. This material is not and should not be construed as an offer to buy or sell any security. It should not be construed as research or investment advice or a recommendation to buy, sell or hold any security or commodity. This material does not and is not intended to take into account the particular financial conditions, investment objectives or requirements of individual customers. Before acting on this material, you should consider whether it is suitable for your particular circumstances and, as necessary, seek professional advice.
