


![[Gamma] Scalping Please](https://ibkrcampus.com/wp-content/smush-webp/2024/04/tir-featured-8-700x394.jpg.webp "[Gamma] Scalping Please")


KEY TAKEAWAYS
- Cutting-edge environmental technologies are here: Mounting breakthroughs from electric vehicles to carbon capture combined with increasing demand and affordability are helping drive growth for environmental technologies.
- Public and private actions towards carbon reduction: Over $710 billion in global environmental spending earmarked towards environmental technologies and over 8,000 corporations signed up for the race to zero campaign, which prioritizes cutting global emissions in half by 2030.1,2,3
- Early-stage technologies are driving innovation: We believe investors may benefit from exposure to ETFs designed to invest in a broad basket of nascent environmental technologies such as pollution reduction, energy efficiency, and breakthroughs in transportation and power.
THE KEY DRIVERS OF NEXT GENERATION ENVIRONMENTAL SOLUTIONS
We see three key reasons why next-generation environmental technologies will be increasingly important in our economy:
First, governments and companies around the globe have made ambitious climate commitments to reduce emissions, and have passed legislation such as the Inflation Reduction Act which designated nearly $400B towards clean energy technologies and electric vehicles.4 Countries representing nearly 90% of the world economy now have net-zero commitments.5 The private sector has also made commitments, with more than one-third of the world’s largest publicly traded companies announcing carbon reduction targets.6 However, the private sector is not just making commitments, they are also following through with their wallet. For example, in 2021 corporate venture capital arms invested $23.2B in businesses in the climate tech sector, more than double the 2020 investment.7 Companies know that meeting these commitments requires leveraging environmental technology breakthroughs across areas such as green transportation, renewable energy and energy efficiency, which have the potential to significantly offset the growth of greenhouse gas emissions.
Second, the shift toward renewable energy has accelerated in some markets amidst a global focus on energy security. For example, Germany announced plans to accelerate their transition to renewables, bringing forward their target for 100% renewable power by 15 years, to 2035.8 New government policies around the globe will lead to annual clean energy investments of more than $2 trillion by 2030, a 50% increase from today’s levels.9
Finally, consumers are reporting increased interest in sustainable products. Whether its buying electric vehicles, installing cutting-edge solar panels on their roof or installing smart meter technologies in their home to reduce energy usage, consumers may continue to turn towards environmentally friendly technologies and products.
Levels of consumer interest in sustainable products
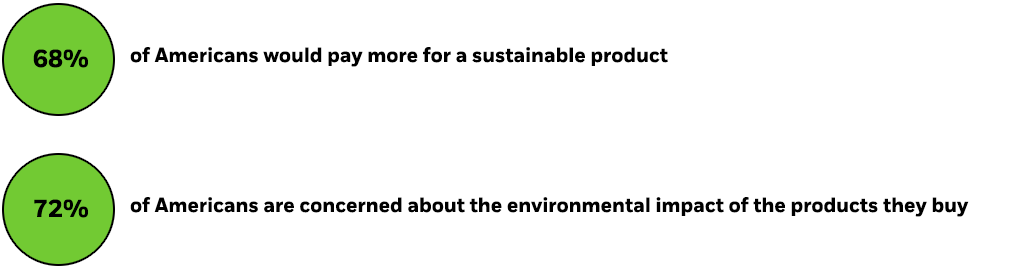
Source: “The Sustainability Disconnect Between Consumers & Retail Executives”, First Insight, Inc., The Baker Retailing Center at the Wharton School of the University of Pennsylvania, Jan 2022.
Chart description: First Insight and the Baker Retailing Center at the Wharton School of the University of Pennsylvania’s findings are based on survey studies of a targeted sample of > 1,000 consumers in the U.S., fielded in 2021. 68% of the consumers say that they are willing to pay more for sustainable products, while 72% of consumers say that sustainability is a very or somewhat important purchase consideration.
THE POTENTIAL BENEFITS OF GETTING THERE EARLY
If investors are looking to gain access to environmental technologies, they may want to consider focusing on companies whose products and services are in the early stages of adoption. Later-stage companies are typically larger and more mature, and already found in broad equity benchmarks such as the S&P 500.
For example, rewind the clock to 2010, when renewable energy’s share of US electricity generation was 10%. Fast forward 10 years and renewable’s share doubled to 20%.10 During this timeframe the S&P Global Clean Energy Index outperformed the S&P 500 energy index by 74%.11 We believe accessing environmental technology companies ahead of their acceleration in adoption could benefit investors, as the transition becomes more fully priced.
Renewable energy share of U.S. electricity generation
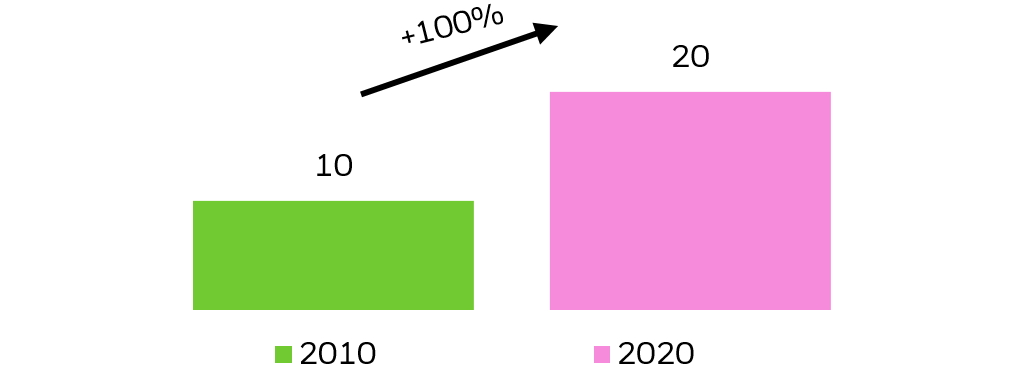
Source: Deloitte Insights. “Renewable transition separating perception from reality”. September 21, 2021.
Chart description: Chart showing that renewable energy’s share of US electricity generation has doubled — from 10% in 2010 to 20% in 2020.
2010 – 2020 Outperformance of S&P Global Clean Energy Index vs. S&P 500 Energy Sector (%)

Source: Morningstar, returns from 1/1/10 to 12/31/20.
Index performance is for illustrative purposes only. Index performance does not reflect any management fees, transaction costs or expenses. Indexes are unmanaged and one cannot invest directly in an index. Past performance does not guarantee future results.
Chart description: Chart showing that the S&P Global Clean Energy Index has outperformed the S&P 500 energy index by 73% from 2010 to 2020. The S&P Global Clean Energy Index returned 67% while the S&P 500 energy index returned -7%.
KEY BREAKTHROUGHS IN ENVIRONMENTAL SOLUTIONS
Below we highlight eight themes that could shape the future of environmental technologies,12 whose potential opportunity may be significant. Click into each of these themes to learn more.
1. GREEN TRANSPORTATION
Did you know? Electric trains emit 20% to 35% less carbon per passenger mile than a diesel train.13
The green transportation theme refers to companies involved in the provision of sustainable transportation products and services such as electric vehicles (EVs) or charging stations. Solid-state batteries are demonstrating key advantages over the more commonly used lithium-ion batters, including higher energy storage density, longer life, and faster charging. Lithium-ion batteries tend to start degrading after 2,000-3,000 charges, whereas solid-state batteries can be charged up to 10,000 times before noticeable degradation.14
The big picture: EVs could represent 60% of new car sales by 2030,15 up from 10% in 2022.16 (Read more about how tax credits, government EV purchases, loans and grants could boost the entire EV value chain.)
2. RENEWABLE ENERGY
Did you know? 2/3 of renewable power added in 2021 had lower costs than the cheapest coal-fired options in G20 countries, and renewables saved the US $55 billion in energy generation costs in 2022.17
One of the criticisms of solar energy is its reliance on the whims of the sun. This becomes an issue for power grids reliant on solar as the most efficient energy storage systems can only store a charge for one to five days. However, recent breakthroughs in a technology called “molecular solar thermal energy storage” (MOST), relies on a very thin chip that can store solar energy in liquid form, for up to 18 years, significantly improving the reliability of solar powered energy sources.18
The big picture: As the transition unfolds, there may still be a large runway for renewables given fossil fuels still supply 82% of the world’s energy.19
3. ENERGY EFFICIENCY
Did you know? Energy efficient appliances could save U.S. households up to 25% on their utility bills, amounting to over $2,200 annually.20
The energy efficiency theme seeks to reduce waste or usage, and traditional heat pumps have plenty of room for improvement. Traditional heat pumps move energy from the outside to heat or cool a home, which is 2-to-3 times more energy efficient than burning fossil fuels to warm the same space. New, innovative heat pumps leverage renewable energy sources to power the heat transfer, reducing emissions by 50% or more.21
The big picture: Global investment in energy efficiency reached $560 billion in 2022 and is projected to increase nearly 50% by 2030.22
4. WATER
Did you know? Over 700 million people live in countries with significant water stress.23
The water theme is focused on areas such as water efficiency technology or water treatment services. For decades, traditional water meters measured the flow of water for businesses and residential homes, to track usage and properly bill customers. Smart water meters leverage technology to track usage in real-time, enabling early detection of irregularities in usage, alerting clients to any issues before they become widespread.
The big picture: The Drinking Water and Wastewater Infrastructure Act of 2021 included $55 billion in spending for restoration and improvement of water and wastewater systems in the United States.24
5. GREEN BUILDINGS
Did you know? Residential and commercial buildings represent nearly 40% of CO2 emissions in the U.S. and 80% of U.S. buildings that will be in use in 2050 are already built.25 Retrofitting existing infrastructure with new technologies will be key to reducing emissions.
The green building theme refers to the design, building and retrofitting of existing physical infrastructure to produce lower emissions. Solar panels have been placed on rooftops for a long time; solar inverters are the latest breakthrough in solar technology. Solar inverters convert electricity from a solar panel into the same current as what a grid requires,26 and are now being leveraged inside glass windows and walls for modern green building construction.
The big picture: According to a recent McKinsey report, decarbonizing existing buildings could be a $1.9 trillion market.27
6. POLLUTION, PREVENTION, AND REDUCTION
Did you know? Air pollution was a contributing factor to nearly 12% of global deaths in 2021.28
This theme targets companies whose products and services are involved with reducing pollutants emitted or capturing previously emitted pollution. For example, traditional carbon capture technology retrofits existing industrial plants so that chemicals can prevent CO2 from being emitted at the source.29 The next innovation is direct carbon capture, which relies on chemical reactions “to pull carbon dioxide out of the air”, including carbon which was released years ago.30
The big picture: According to the International Energy Agency, carbon capture and storage technology could contribute more than 20% of emissions reduction required from the industrials sector.31
7. RESOURCE EFFICIENCY
Did you know? Our economy consumes 100 billion tons of material each year and wastes over 90% of that material.32
Resource efficiency companies support a circular economy, and their products and services enable activities such as recycling or resource recovery. As the electrification of transportation continues, recycling precious metals from batteries has become increasingly important. Traditional recycling methods, called pyrometallurgy, required melting down the batteries and burning off the plastic to extract the precious metals, emitting toxic gases.33 New recycling technologies involve a chemical process which allows fresh lithium to be added to the battery, to return it to full charging capacity.34
The big picture: The circular economy, an economy that give incentives to reusing products rather than extracting new resources,35 is expected to grow from $1 trillion in 2025 to $4.5 trillion in 2030.36
8. SUSTAINALE AGRICULTURE, FOOD & FORESTRY
Did you know? Agriculture accounts for over 11% of U.S. GHG emissions.37
Plant-based meat was first introduced into our lexicon in the 1970s, but lab-grown meat is earlier in its adoption. Lab-grown meat is grown from cells harvested from an animal. One tissue sample taken from a cow can create up to 10,000 kg of meat, meaning 150 cows could feed the entire global population without slaughtering a single animal!38
The big picture: By 2050, there will be over 9 billion people on the planet, and food production will need to increase by 70% to meet growing demand.39 (Learn more about investing in food innovation and ag tech.)
A DIFFERENT WAY TO INVEST IN ENVIRONMENTAL TECH
With popular equity benchmarks such as the S&P 500 index lacking material exposure to environmental tech themes such as renewable energy, green transportation, and energy efficiency,41 a thematic investing strategy that delivers exposure to multiple environmental tech themes could make sense. For example, the Morningstar Global Emerging Green Technologies Select Index targets innovative companies with >25% revenue exposure to the eight themes listed below.
| Emerging Green Technology Category | Weight in Morningstar Global Emerging Green Technologies Select Index |
|---|---|
| Green transportation | 29% |
| Renewable energy | 26% |
| Energy efficiency | 20% |
| Water | 10% |
| Green buildings | 5% |
| Pollution prevention and reduction | 5% |
| Resource efficiency, technologies, and services | 4% |
| Sustainable agriculture, food, and forestry | 0% |
Source: Morningstar, Holdings as of 02/20/23. Weights reflect holdings in Morningstar Global Emerging Green Technologies Select Index.
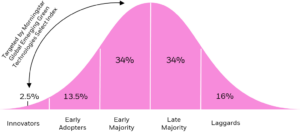
The index is specifically focused on capturing companies whose products/services are “emerging green technologies”, defined as being in the innovators through early majority stage of the Rogers adoption curve,42 which means at least 50% of the product’s adoption has yet to occur.
Roger’s Innovation Adoption Curve
The %’s reflect the % of consumers which have adopted a product.
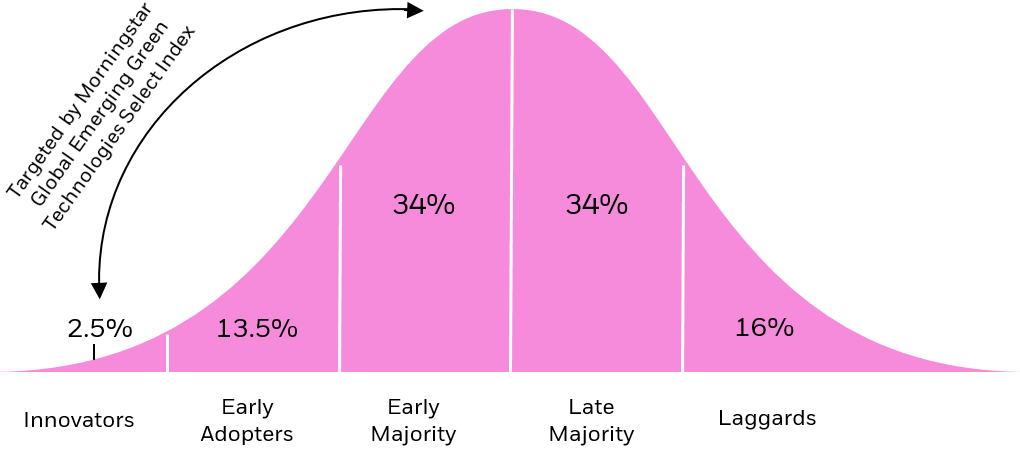
Source: Morningstar Global Emerging Green Technologies Select Index.
Chart description: The above chart is an illustration of the Roger’s innovation adoption curve, which measures the cumulative rate at which a population adopts a product or service over time. The adoption stage is determined by assessing the total addressable market and market share (e.g., EVs represented <9% of total car sales in 2021, therefore EVs would fall into the Early Adopters section of the adoption curve).
CONCLUSION
Sixty-eight years after the first ever piece of federal air pollution legislation,43 the world has transitioned to an era of increased focus on the environment, impacting all areas of the economy. A wide swath of environmental technologies could be positioned to benefit, and investors may want to consider ETFs that hold pure-play firms across the full value chain of environmental technologies, targeting themes such as green transportation or clean energy.
—
Originally Posted March 30, 2023 – Investing in the next generation of environmental tech breakthroughs
© 2023 BlackRock, Inc. All rights reserved.
1 International Energy Agency, “Clean energy spending in governments’ economic recovery packages has surged by 50% since the end of October, reached unprecedented levels”, 4/12/22.
2 United Nations Framework Convention on Climate Change, “Race to Zero Campaign”, accessed on 3/9/23.
3 UNFCC, “Race to Zero Campaign Overview”.
4 BlackRock, “Investment implications of U.S. transition policy”, January 2023.
5 BlackRock Investment Institute, “Managing the net-zero transition”, February 2022.
6 Zerotracker.net, 6/13/22.
7 WSJ, “Corporate venture investors boost climate-tech spending”, 3/16/22.
8 Bloomberg, “Germany brings forward goal of 100% renewable power to 2035”, 2/28/22.
9 International Energy Agency, World Energy Outlook, October 2022.
10 Deloitte Insights. “Renewable transition separating perception from reality.” 9/21/21.
11 Morningstar, returns from 1/1/10 through 12/31/20.
12 These eight themes are outlined by the Morningstar Global Emerging Green Technologies Select Index.
13 QZ.com, “Tanzania’s new electric rail will help it cut emissions”, 7/5/22.
14 AZO CleanTech, Owais Ali, “Revolutionary new electric vehicle battery charges in 3 minutes and lasts 20 years”, 7/6/23.
15 International Energy Agency, September 2022. Accessed on 3/3/23.
16 WSJ, William Boston, 1/16/23.
17 UN.org, “Renewables: cheapest form of power”. Accessed on 3/3/23.
18 Economist, 6/20/22, “Data point: a breakthrough in storing solar power”.
19 BP Statistical Review of World Energy, 2022.
20 National Renewable Energy Laboratory, “Energy Saver, Tips on Saving Money & Energy at Home”, accessed on 3/20/23.
21 Natural Resources Defense Council, “Driving the market for heat-pumps in the northeast”.
22 International Energy Agency, “Energy efficiency 2022”, December 2022. Forward estimates may not come to pass.
23 UN, SDG 6, accessed on 3/5/23.
24 McKinsey, US water infrastructure: making funding count, 11/24/21.
25 Environmental and Energy Study Institute, “Buildings and Built Infrastructure”.
26 Energy.gov, “Solar Integration” McKinsey, “Accelerating green growth in the built environment”, 11/2/22.
27 McKinsey, “Accelerating green growth in the built environment”, 11/2/22.
28 Our World in Data, January 2021 “Air Pollution”.
29 Congressional Research Service, November 2021.
30 World Resources Institute, May 2022, “6 things to know about carbon capture”, 5/2/22.
31 International Energy Agency, “Transforming industry through CCUS”, May 2019.
32 Circularity Gap Report, 2022.
33 Science.org, “A dead battery dilemma”, 5/20/21.
34 Annual Reviews, Knowable Magazine. “What will it take to recycle millions of worn-out EV batteries”, 9/21/22.
35 UN Conference on Trade and Development, “Circular economy”, accessed on 3/6/23.
36 Brookings, “Will the global circular economy help or hurt Africa”, 1/30/23. Forward estimates may not come to pass.
37 U.S. Department of Agriculture, “Agriculture greenhouse gas emissions’’, Accessed on 3/3/23.
38 Harvard University Graduate School of Arts and Sciences, “(Meat) pie in the sky? – When will our appetite for lab-grown meat be satisfied”.
39 IBM, “The benefits of sustainable agriculture and how we get there”, 3/24/21.
40 As measured by the 1.7% overlap between the Morningstar Global Emerging Green Technologies Select Index and the S&P 500 index. As of 3/22/23.
41 The Rogers adoption curve measures the cumulative rate at which a population adopts a product or service over time. The curve was popularized by Everett Rogers in his 1962 book, “Diffusion of Innovation”.
42 EPA.gov, “Evolution of the Clean Air Act”.
Carefully consider the Funds’ investment objectives, risk factors, and charges and expenses before investing. This and other information can be found in the Funds’ prospectuses or, if available, the summary prospectuses, which may be obtained by visiting the iShares Fund and BlackRock Fund prospectus pages. Read the prospectus carefully before investing.
Investing involves risk, including possible loss of principal.
International investing involves risks, including risks related to foreign currency, limited liquidity, less government regulation and the possibility of substantial volatility due to adverse political, economic or other developments. These risks often are heightened for investments in emerging/ developing markets or in concentrations of single countries.
Funds that concentrate investments in specific industries, sectors, markets or asset classes may underperform or be more volatile than other industries, sectors, markets or asset classes and than the general securities market.
Technologies perceived to displace older technologies or create new markets may not in fact do so. Companies that initially develop a novel technology may not be able to capitalize on the technology.
There can be no assurance that an active trading market for shares of an ETF will develop or be maintained.
Actively managed funds do not seek to replicate the performance of a specified index. Actively managed funds may have higher portfolio turnover than index funds.
This material represents an assessment of the market environment as of the date indicated; is subject to change; and is not intended to be a forecast of future events or a guarantee of future results. This information should not be relied upon by the reader as research or investment advice regarding the funds or any issuer or security in particular.
The strategies discussed are strictly for illustrative and educational purposes and are not a recommendation, offer or solicitation to buy or sell any securities or to adopt any investment strategy. There is no guarantee that any strategies discussed will be effective.
This material contains general information only and does not take into account an individual’s financial circumstances. This information should not be relied upon as a primary basis for an investment decision. Rather, an assessment should be made as to whether the information is appropriate in individual circumstances and consideration should be given to talking to a financial professional before making an investment decision.
The information provided is not intended to be tax advice. Investors should be urged to consult their tax professionals or financial professionals for more information regarding their specific tax situations.
The Funds are distributed by BlackRock Investments, LLC (together with its affiliates, “BlackRock”).
The iShares Funds are not sponsored, endorsed, issued, sold or promoted by Bloomberg, BlackRock Index Services, LLC, Cboe Global Indices, LLC, Cohen & Steers, European Public Real Estate Association (“EPRA® ”), FTSE International Limited (“FTSE”), ICE Data Indices, LLC, NSE Indices Ltd, JPMorgan, JPX Group, London Stock Exchange Group (“LSEG”), MSCI Inc., Markit Indices Limited, Morningstar, Inc., Nasdaq, Inc., National Association of Real Estate Investment Trusts (“NAREIT”), Nikkei, Inc., Russell, S&P Dow Jones Indices LLC or STOXX Ltd. None of these companies make any representation regarding the advisability of investing in the Funds. With the exception of BlackRock Index Services, LLC, who is an affiliate, BlackRock Investments, LLC is not affiliated with the companies listed above.
Neither FTSE, LSEG, nor NAREIT makes any warranty regarding the FTSE Nareit Equity REITS Index, FTSE Nareit All Residential Capped Index or FTSE Nareit All Mortgage Capped Index. Neither FTSE, EPRA, LSEG, nor NAREIT makes any warranty regarding the FTSE EPRA Nareit Developed ex-U.S. Index, FTSE EPRA Nareit Developed Green Target Index or FTSE EPRA Nareit Global REITs Index. “FTSE®” is a trademark of London Stock Exchange Group companies and is used by FTSE under license.
©2023 BlackRock, Inc or its affiliates. All Rights Reserved. BLACKROCK, iSHARES, iBONDS, ALADDIN and the iShares Core Graphic are trademarks of BlackRock, Inc. or its affiliates. All other trademarks are those of their respective owners.
iCRMH0323U/S-2802264
Disclosure: iShares by BlackRock
The iShares Funds are distributed by BlackRock Investments, LLC (together with its affiliates, “BlackRock”).
The iShares Funds are not sponsored, endorsed, issued, sold or promoted by Markit Indices Limited, nor does this company make any representation regarding the advisability of investing in the Funds. BlackRock is not affiliated with Markit Indices Limited.
©2022 BlackRock, Inc. All rights reserved. iSHARES and BLACKROCK are registered trademarks of BlackRock, Inc., or its subsidiaries in the United States and elsewhere. All other marks are the property of their respective owners.
Disclosure: Interactive Brokers
Information posted on IBKR Campus that is provided by third-parties does NOT constitute a recommendation that you should contract for the services of that third party. Third-party participants who contribute to IBKR Campus are independent of Interactive Brokers and Interactive Brokers does not make any representations or warranties concerning the services offered, their past or future performance, or the accuracy of the information provided by the third party. Past performance is no guarantee of future results.
This material is from iShares by BlackRock and is being posted with its permission. The views expressed in this material are solely those of the author and/or iShares by BlackRock and Interactive Brokers is not endorsing or recommending any investment or trading discussed in the material. This material is not and should not be construed as an offer to buy or sell any security. It should not be construed as research or investment advice or a recommendation to buy, sell or hold any security or commodity. This material does not and is not intended to take into account the particular financial conditions, investment objectives or requirements of individual customers. Before acting on this material, you should consider whether it is suitable for your particular circumstances and, as necessary, seek professional advice.
Disclosure: ETFs
Any discussion or mention of an ETF is not to be construed as recommendation, promotion or solicitation. All investors should review and consider associated investment risks, charges and expenses of the investment company or fund prior to investing. Before acting on this material, you should consider whether it is suitable for your particular circumstances and, as necessary, seek professional advice.
Disclosure: Complex or Leveraged Exchange-Traded Products
Complex or Leveraged Exchange-Traded Products are complicated instruments that should only be used by sophisticated investors who fully understand the terms, investment strategy, and risks associated with the products. Learn more about the risks here: https://gdcdyn.interactivebrokers.com/Universal/servlet/Registration_v2.formSampleView?formdb=4155
Disclosure: Futures Trading
Futures are not suitable for all investors. The amount you may lose may be greater than your initial investment. Before trading futures, please read the CFTC Risk Disclosure. A copy and additional information are available at ibkr.com.


