


Powerful technological advances fuel economic growth by enabling economies to create more value with fewer inputs. That’s been true since the invention of the steam engine during the first Industrial Revolution to the Fourth Industrial Revolution still unfolding now.
Today the speed and impact of technological breakthroughs are exponential and unprecedented. Easy access to super computing power; rapid developments in artificial intelligence; robotics and automation; hyperconnectivity between the physical and digital world; and biological innovations are the driving forces behind technological breakthroughs that continue to transform society.
And yet, many portfolios lack exposures to innovation. Therefore, the question for investors becomes how best to identify and capture the economic benefits of innovation.
Innovation Premium Delivers Capital Appreciation
For some investors, innovation stocks may seem just too risky. And it’s true that companies developing and leading technological innovation face greater risks — from the cost of completion and uncertain future cash flows to the risk of obsolescence.1 But there is something that compensates investors for taking on these risks: the Innovation Premium.
Empirical research shows companies that drive technological innovation deliver higher shareholder returns.
Companies ranked in the top 20% for innovation had double the shareholder returns of their industry peers, according to research by Arthur D. Little, the world’s first management consulting firm, which examined the shareholder returns of 338 Fortune 500 companies between 1987 and 1996.2
And strong research & development (R&D) activity, an important driver of innovation, correlates to significant positive stock returns that asset pricing models like Fama-French 5-factor and 3-factor models cannot explain.3
While the Innovation Premium may be attractive, it’s important to understand why innovative companies tend to outperform. Some researchers argue that innovative companies are able to provide higher quality products and services and create a wide economic moat, leading to greater pricing power and higher profitability.
Other researchers consider outperformance through a behavioral finance lens. Certainly, uncertainties along the path from patents to final products, the velocity of disruption, new products’ impacts on competition and industry structure, and long-deferred profits are all ¬challenging for investors to analyze. And the difficulty in processing this less tangible information can cause markets to underreact to news about the prospects of firms’ innovations, resulting in the mispricing of innovation stocks.4
Capture Early Stage Growth of Innovation Companies
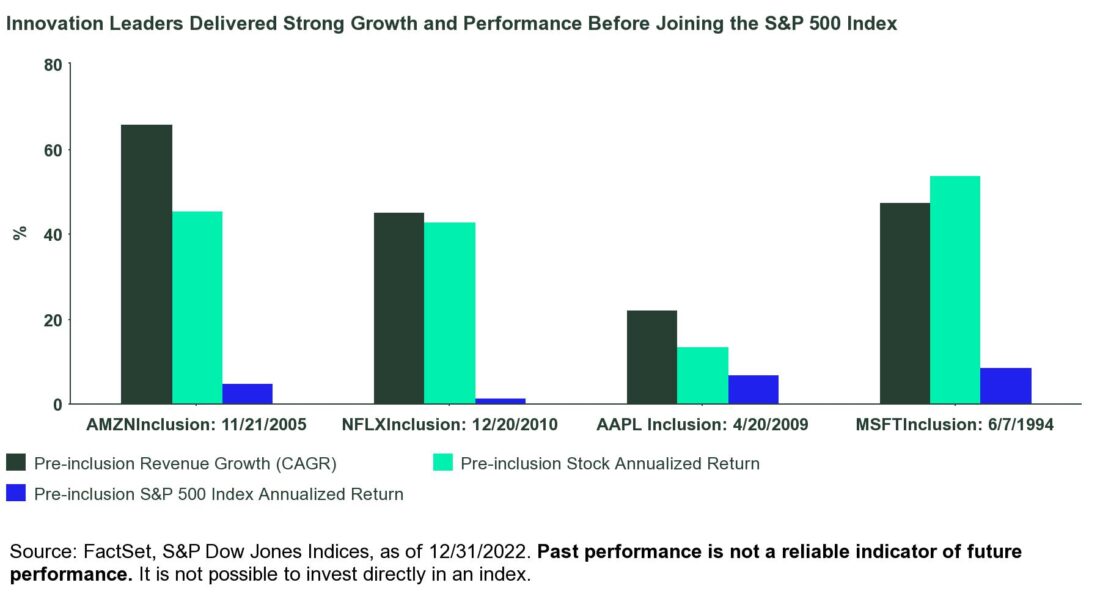
Taking advantage of mispriced innovative stocks requires identifying and investing in innovative companies in their early stages. For example, some of the most-recognized innovative brands — Amazon, Netflix, Microsoft, and Apple Inc. — were included in the S&P 500 Index more than eight years after filing their initial public offering (IPO).
By the time Apple Inc. was included, the iPhone had already been in market for two years and was the company’s largest contributor to revenue growth. In fact, all of the aforementioned innovative companies experienced significant revenue growth and stock price appreciation and outperformed the broad market for many years before being included in the S&P 500 Index, as shown below.
Given the underrepresentation of innovators in the S&P 500 Index in their early days, most investors’ portfolios likely missed out on significant capital appreciation during the initial stage of growth.
Exponential Growth Creates Long-term Investment Opportunities
Since innovative companies derive a large percentage of their value from future inventions — and from future cash flows generated by the monetization of those inventions — uncertainty around new technology development, customer adoption, and market structure change can impact their valuations significantly. Changes to the risk-free rate and investors’ risk sentiment also drive big valuation movements by impacting discount rates.
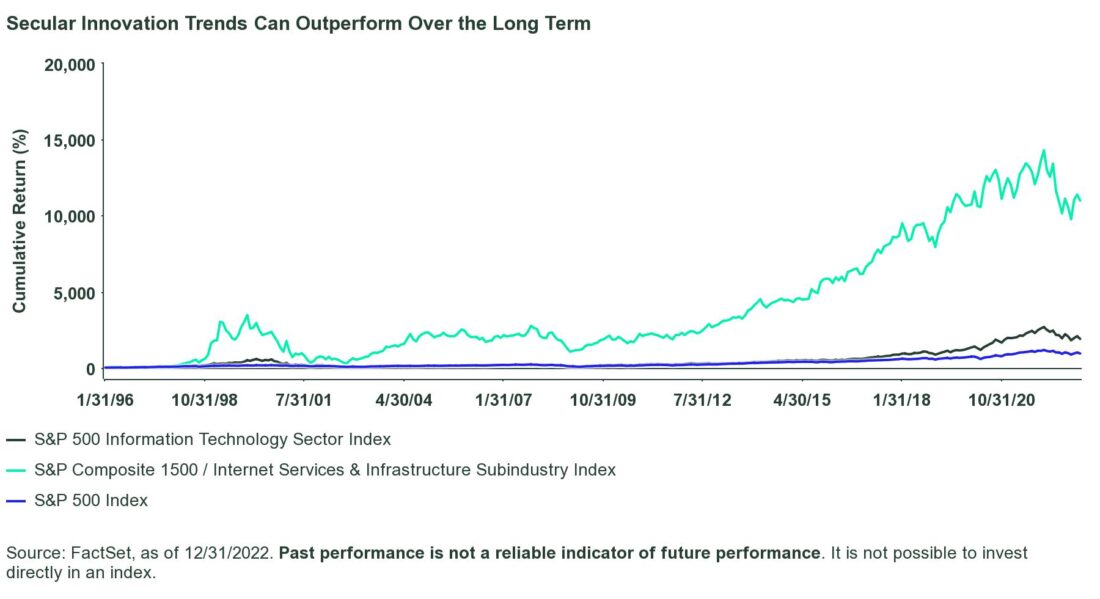
But because secular innovation trends can transcend monetary and market cycles, innovation stocks offer greater capital appreciation potential than the broad market over long-term investment horizons. In other words, innovation trends can supersede financial market boom and bust cycles and reward investors over the long term. A good example of this? The internet services and infrastructure industry.
In the eight years between 1995 and 2002, the Federal Reserve Bank conducted two rate-hiking cycles, increasing the policy rate from 3% to 6% between 1994 and 1995 and from 4.6% to 6.5% between 1999 and 2000. During the same period, internet services and infrastructure stocks saw seven of their largest yearly drawdowns ever. But none of those reversed the exponential increase in internet users and internet use cases that supported the industry’s incredible growth, which ultimately drove its outperformance over the broad market and the broader Technology sector in the subsequent 20 years.
Click here to read the full article
Footnotes
1 Richard P. Rumelt, “Theory, Strategy and Entrepreneurship,” 1987.
2 Ronald S. Jonash and Tom Sommerlatte,”The Innovation Premium: Capturing the Value of Creativity,” 1999.
3 Alessandro Grandi, Bronwyn H. Hall, Raffaele Oriani, “R&D and Financial Investors,” UC Berkeley, 2009.
4 David Hirshleifer, Po-Hsuan Hsu, Dongmei Li, “Innovative Efficiency and Stock Returns,” Journal of Financial Economics, Vol. 107, 2013.
5Holmes and Schitz (1990), Ueda (1997) and Takii (1999), “The Information Technology Revolution and the Stock Market: Evidence.”
6 Holmes and Schitz (1990), Ueda (1997) and Takii (1999), “The Information Technology Revolution and the Stock Market: Evidence.”
7 Dane Rook, Adam Salvatori, John van Moyland, and Paul Rosa, “Innovation Patterns: Upgrading Sectoral Classification for the Fourth Industrial Revolution,” March 2017.
Glossary
Fama French Three Factor Model
An asset pricing model named after economists Eugene Fama and Kenneth French that expands on the capital asset pricing model (CAPM) by adding size and value factors to CAPM’s market risk, or beta, factor. The Fama-French model is based on data showing that value and small-cap stocks outperform markets regularly. In the fund industry, Fama and French’s insights fueled the rise of style boxes and, more recently, the rise of ‘smart beta’ indices and ETFs.
National Bureau of Economic Research (NBER)
A private, non-profit, non-partisan group that conducts economic research and disseminates findings among academics, public policy makers, and business professionals. Key focus areas include developing new statistical measurements, estimating quantitative models of economic behavior, and analyzing effects of public policies. NBER data surrounding the occurrence and duration of recessions are frequently cited across the financial services industry. NBER is based in Cambridge, Massachusetts.
S&P 500® Index
A popular benchmark for U.S. large-cap equities that includes 500 companies from leading industries and captures approximately 80% coverage of available market capitalization.
—
Originally Posted March 10, 2023 – A Case for Investing in Innovation
Risk Disclosure
Investing involves risk including the risk of loss of principal.
The information provided does not constitute investment advice and it should not be relied on as such. It should not be considered a solicitation to buy or an offer to sell a security. It does not take into account any investor’s particular investment objectives, strategies, tax status or investment horizon. You should consult your tax and financial advisor.
The trademarks and service marks referenced herein are the property of their respective owners. Third party data providers make no warranties or representations of any kind relating to the accuracy, completeness or timeliness of the data and have no liability for damages of any kind relating to the use of such data.
KENSHO® is a registered service mark of Kensho Technologies Inc. (“Kensho”), and all Kensho financial indices in the Kensho New Economies® family and such indices’ corresponding service marks have been licensed by the Licensee in connection with the SPDR Kensho Intelligent Structures ETF, SPDR Kensho Smart Mobility ETF, SPDR Kensho Future Security ETF, SPDR Kensho Clean Power ETF, SPDR Kensho Final Frontiers ETF and SPDR Kensho New Economies Composite ETF (collectively, the “SPDR ETFs”). The SPDR ETFs are not marketed, sold, or sponsored by Kensho, Kensho’s affiliates, or Kensho’s third party licensors.
Kensho is not an investment adviser or broker-dealer and Kensho makes no representation regarding the advisability of investing in any investment fund, other investment vehicle, security or other financial product regardless of whether or not it is based on, derived from, or included as a constituent of any Kensho New Economies© family index. Kensho bears no responsibility or liability for any business decision, input, recommendation, or action taken based on Kensho indices or any products based on, derived from, or included as a constituent of any such index. All referenced names and trademarks are the property of their respective owners.
Concentrated investments in a particular sector or industry tend to be more volatile than the overall market and increases risk that events negatively affecting such sectors or industries could reduce returns, potentially causing the value of the Fund’s shares to decrease.
The whole or any part of this work may not be reproduced, copied or transmitted or any of its contents disclosed to third parties without SSGA’s express written consent.
All information is from SSGA unless otherwise noted and has been obtained from sources believed to be reliable, but its accuracy is not guaranteed. There is no representation or warranty as to the current accuracy, reliability or completeness of, nor liability for, decisions based on such information and it should not be relied on as such
Diversification does not ensure a profit or guarantee against loss.
Non-diversified funds that focus on a relatively small number of securities tend to be more volatile than diversified funds and the market as a whole.
Disclosure: State Street Global Advisors
Do not reproduce or reprint without the written permission of SSGA.
All information has been obtained from sources believed to be reliable, but its accuracy is not guaranteed. There is no representation or warranty as to the current accuracy, reliability or completeness of, nor liability for, decisions based on such information and it should not be relied on as such.
State Street Global Advisors and its affiliates (“SSGA”) have not taken into consideration the circumstances of any particular investor in producing this material and are not making an investment recommendation or acting in fiduciary capacity in connection with the provision of the information contained herein.
ETFs trade like stocks, are subject to investment risk, fluctuate in market value and may trade at prices above or below the ETF’s net asset value. Brokerage commissions and ETF expenses will reduce returns.
Bonds generally present less short-term risk and volatility than stocks, but contain interest rate risk (as interest rates raise, bond prices usually fall); issuer default risk; issuer credit risk; liquidity risk; and inflation risk. These effects are usually pronounced for longer-term securities. Any fixed income security sold or redeemed prior to maturity may be subject to a substantial gain or loss.
Investing involves risk including the risk of loss of principal.
The whole or any part of this work may not be reproduced, copied or transmitted or any of its contents disclosed to third parties without SSGA’s express written consent.
Investing in high yield fixed income securities, otherwise known as “junk bonds”, is considered speculative and involves greater risk of loss of principal and interest than investing in investment grade fixed income securities. These Lower-quality debt securities involve greater risk of default or price changes due to potential changes in the credit quality of the issuer.
COPYRIGHT AND OTHER RIGHTS
Other third party content is the intellectual property of the respective third party and all rights are reserved to them. All rights reserved. No organization or individual is permitted to reproduce, distribute or otherwise use the statistics and information in this report without the written agreement of the copyright owners.
Definition:
Arbitrage: the simultaneous buying and selling of securities, currency, or commodities in different markets or in derivative forms in order to take advantage of differing prices for the same asset.
Fund Objectives:
SPY: The investment seeks to provide investment results that, before expenses, correspond generally to the price and yield performance of the S&P 500® Index. The Trust seeks to achieve its investment objective by holding a portfolio of the common stocks that are included in the index (the “Portfolio”), with the weight of each stock in the Portfolio substantially corresponding to the weight of such stock in the index.
VOO: The investment seeks to track the performance of a benchmark index that measures the investment return of large-capitalization stocks. The fund employs an indexing investment approach designed to track the performance of the Standard & Poor’s 500 Index, a widely recognized benchmark of U.S. stock market performance that is dominated by the stocks of large U.S. companies. The advisor attempts to replicate the target index by investing all, or substantially all, of its assets in the stocks that make up the index, holding each stock in approximately the same proportion as its weighting in the index.
IVV: The investment seeks to track the investment results of the S&P 500 (the “underlying index”), which measures the performance of the large-capitalization sector of the U.S. equity market. The fund generally invests at least 90% of its assets in securities of the underlying index and in depositary receipts representing securities of the underlying index. It may invest the remainder of its assets in certain futures, options and swap contracts, cash and cash equivalents, as well as in securities not included in the underlying index, but which the advisor believes will help the fund track the underlying index.
The funds presented herein have different investment objectives, costs and expenses. Each fund is managed by a different investment firm, and the performance of each fund will necessarily depend on the ability of their respective managers to select portfolio investments. These differences, among others, may result in significant disparity in the funds’ portfolio assets and performance. For further information on the funds, please review their respective prospectuses.
Entity Disclosures:
The trademarks and service marks referenced herein are the property of their respective owners. Third party data providers make no warranties or representations of any kind relating to the accuracy, completeness or timeliness of the data and have no liability for damages of any kind relating to the use of such data.
SSGA Funds Management, Inc. serves as the investment advisor to the SPDR ETFs that are registered with the United States Securities and Exchange Commission under the Investment Company Act of 1940. SSGA Funds Management, Inc. is an affiliate of State Street Global Advisors Limited.
Intellectual Property Disclosures:
Standard & Poor’s®, S&P® and SPDR® are registered trademarks of Standard & Poor’s® Financial Services LLC (S&P); Dow Jones is a registered trademark of Dow Jones Trademark Holdings LLC (Dow Jones); and these trademarks have been licensed for use by S&P Dow Jones Indices LLC (SPDJI) and sublicensed for certain purposes by State Street Corporation. State Street Corporation’s financial products are not sponsored, endorsed, sold or promoted by SPDJI, Dow Jones, S&P, their respective affiliates and third party licensors and none of such parties make any representation regarding the advisability of investing in such product(s) nor do they have any liability in relation thereto, including for any errors, omissions, or interruptions of any index.
BLOOMBERG®, a trademark and service mark of Bloomberg Finance, L.P. and its affiliates, and BARCLAYS®, a trademark and service mark of Barclays Bank Plc., have each been licensed for use in connection with the listing and trading of the SPDR Bloomberg Barclays ETFs.
Distributor: State Street Global Advisors Funds Distributors, LLC, member FINRA, SIPC, an indirect wholly owned subsidiary of State Street Corporation. References to State Street may include State Street Corporation and its affiliates. Certain State Street affiliates provide services and receive fees from the SPDR ETFs.
ALPS Distributors, Inc., member FINRA, is distributor for SPDR® S&P 500®, SPDR® S&P MidCap 400® and SPDR® Dow Jones Industrial Average, all unit investment trusts. ALPS Distributors, Inc. is not affiliated with State Street Global Advisors Funds Distributors, LLC.
Before investing, consider the funds’ investment objectives, risks, charges, and expenses. For SPDR funds, you may obtain a prospectus or summary prospectus containing this and other information by calling 1‐866‐787‐2257 or visiting www.spdrs.com. Please read the prospectus carefully before investing.
Disclosure: Interactive Brokers
Information posted on IBKR Campus that is provided by third-parties does NOT constitute a recommendation that you should contract for the services of that third party. Third-party participants who contribute to IBKR Campus are independent of Interactive Brokers and Interactive Brokers does not make any representations or warranties concerning the services offered, their past or future performance, or the accuracy of the information provided by the third party. Past performance is no guarantee of future results.
This material is from State Street Global Advisors and is being posted with its permission. The views expressed in this material are solely those of the author and/or State Street Global Advisors and Interactive Brokers is not endorsing or recommending any investment or trading discussed in the material. This material is not and should not be construed as an offer to buy or sell any security. It should not be construed as research or investment advice or a recommendation to buy, sell or hold any security or commodity. This material does not and is not intended to take into account the particular financial conditions, investment objectives or requirements of individual customers. Before acting on this material, you should consider whether it is suitable for your particular circumstances and, as necessary, seek professional advice.


