


On March 12th, I Tweeted that the level of VXN (CBOE NDX Volatility Index) was higher than that of VIX (CBOE Volatility Index) and reported that it was a highly unusual occurrence. At the time, I was not quite sure whether this was a fleeting anomaly or whether there was significance to it. Just over a month later, the anomaly persists, and frankly I remain unsure what to make of it.
My concerns are that we are unable to say that we are truly in the clear as long as this situation persists. It also raises the worry that while many investors believe that we saw market capitulation a few sessions ago, we never really saw capitulation in the mega-cap stocks that dominate the NASDAQ 100 Stock Index (NDX)
There is a certain logic to the relative quiescence of VXN relative to VIX. About 47% NDX weight is concentrated in its top 6 components: Microsoft (MSFT), Apple (AAPL), Amazon (AMZN), Alphabet (GOOG, GOOGL), Facebook (FB) and Intel (INTC). Those stocks comprise about 20% of the weight of the S&P 500 Index (SPX). Furthermore, NDX has no financial or energy companies and little exposure to retail. Those sectors have been a drag on SPX.
Below are some graphs that illustrate the phenomenon. The charts immediately below show the relationship between VIX and VXN over the past year. The green area in the middle of the three graphs shows the recent period where VIX has exceeded VXN, while the bottom graph shows the exceedingly high correlation between the two indices. The high correlation is unsurprising, as markets tend to show increased correlation during times of dislocation and there is high degree of overlap between the SPX and NDX indices that underlie them.
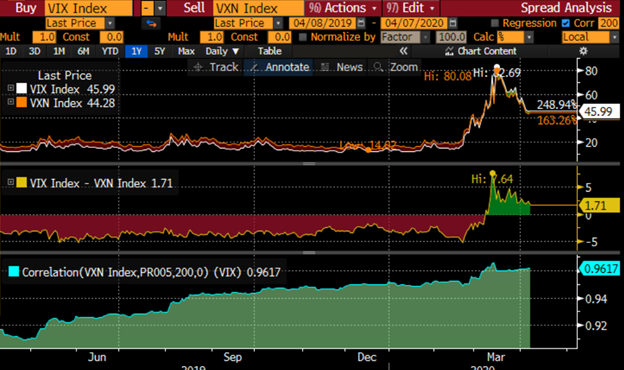
Source: Bloomberg
While this is certainly unusual over the past year, I decided to examine the historical precedent for this type of behavior. It is indeed exceedingly rare and typically fleeting, as evidenced by the 14-year chart below:
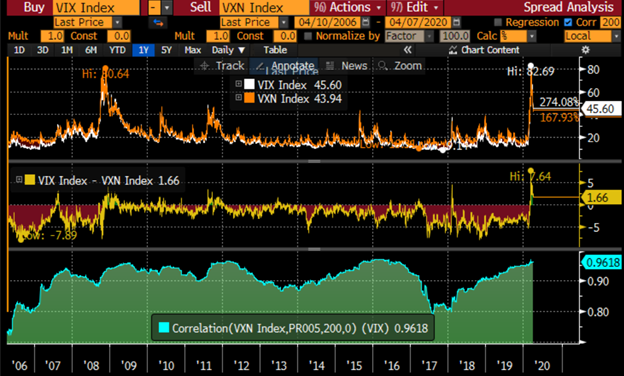
I cut off the data at 14 years because there were no occurrences prior to the 2007 market crisis. That is unsurprising, because many of the components in the tech-heavy NDX were more volatile than the blue-chips that led its more diversified counterpart. We see from the middle chart that there were few occurrences of VIX outpacing VXN after the markets found their footing in 2009. Most of those also were accompanied by market events that caused volatility to spike, such as the volatility crunch of early 2018.
Returning to the potential investment thesis behind this anomaly, the decision that investors must face is whether the relative calm in the largest names in NDX can persist. If you believe that the market correction is incomplete unless the capitulation encompasses the entire market, including its leaders, then the fact that VIX is outpacing VXN should be worrisome. If you believe that those leaders have seen their worst, then this anomaly may simply be just an oddity.
Disclosure: Interactive Brokers
The analysis in this material is provided for information only and is not and should not be construed as an offer to sell or the solicitation of an offer to buy any security. To the extent that this material discusses general market activity, industry or sector trends or other broad-based economic or political conditions, it should not be construed as research or investment advice. To the extent that it includes references to specific securities, commodities, currencies, or other instruments, those references do not constitute a recommendation by IBKR to buy, sell or hold such investments. This material does not and is not intended to take into account the particular financial conditions, investment objectives or requirements of individual customers. Before acting on this material, you should consider whether it is suitable for your particular circumstances and, as necessary, seek professional advice.
The views and opinions expressed herein are those of the author and do not necessarily reflect the views of Interactive Brokers, its affiliates, or its employees.
Disclosure: Futures Trading
Futures are not suitable for all investors. The amount you may lose may be greater than your initial investment. Before trading futures, please read the CFTC Risk Disclosure. A copy and additional information are available at ibkr.com.

