


By J.C. Parets & All Star Charts
Thursday, 2nd March, 2023
1/ Bullish Engulfing for SPX
2/ The Next Generation Is Ready to Lead
3/ European Financials Gain Traction
4/ Rotation Points to Energy
Investopedia is partnering with All Star Charts on this newsletter, which both sells its research to investors, and may trade or hold positions in securities mentioned herein. The contents of this newsletter are for informational and educational purposes only, however, and do not constitute investing advice.
1/ Bullish Engulfing for SPX
A bullish engulfing pattern occurs when the trading range for a given session completely engulfs that of the prior session, with price closing higher.
It means price made new lows on the day, but recovered to make new highs, closing above both the prior day’s opening and closing price. Here’s what it looks like, using today’s daily candlestick chart in the S&P 500 as an example:

For a bullish engulfing candlestick pattern to fully complete, there needs to be upside follow-through in the subsequent session, or another green candlestick tomorrow.
If we get it, it could provide solid evidence that a tradeable low is in for stocks following the corrective action in February. It could make sense for the recent selloff to halt and for a new leg higher to kick off at the 200-day moving average (MA).
2/ The Next Generation Is Ready to Lead
When it comes to relative trends, one in particular caught our attention this week.
The Nasdaq Next Gen 100 ETF (QQQJ) found support at former resistance relative to the Nasdaq 100 ETF (QQQ).
The QQQJ is an index comprised by the 101st to the 200th largest companies by market cap on the Nasdaq, while QQQ comprises the largest 100 stocks. The two ETFs are proxies for the performance of mid-cap and large-cap technology stocks, respectively.

Notice that momentum (as measured by the 14-day RSI) has been diverging positively, suggesting a potential bounce in this relationship.
If and when that happens, we could expect to see the next generation of the Nasdaq outperform its large-cap peers.
3/ European Financials Gain Traction
The European Financials ETF (EUFN) is considered one of the most critical sectors in the world as it provides an excellent overview of the current market environment.
Not only has this group done well on an absolute basis, it has also gained traction on a relative basis.
The chart below shows EUFN breaking out from a multi-year reversal pattern relative to the MSCI EAFE ETF (EFA):
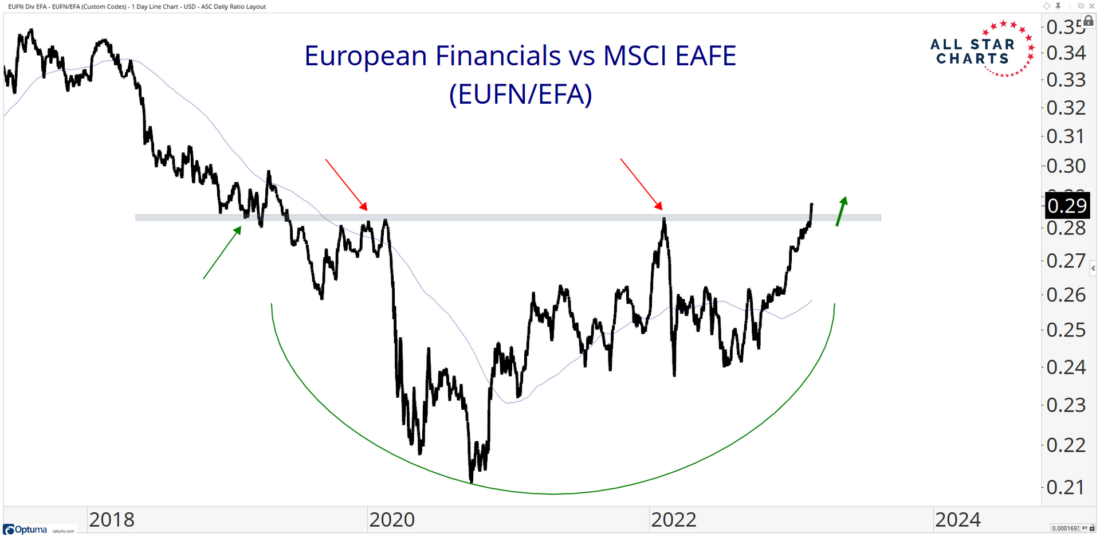
Seeing this ratio making a valid upside resolution suggests a healthy increase in risk-seeking behavior. Under this scenario, it’s difficult to see the stock market and the global economy breaking down.
4/ Rotation Points to Energy
Energy-related commodities have represented downside risk and opportunity cost since late last spring. It’s hard to argue that has changed, especially when looking at a chart of natural gas futures.
Nonetheless, these beaten-down contracts might be ready for some outperformance. Below is our ratio chart of the equal-weight energy vs. base and industrial metal indexes:

These two indexes cover the main pro-cyclical commodity groups—the areas most sensitive to economic conditions. After running into a logical resistance level and rolling over, energy contracts are digging in at former support levels relative to base metals.
While the absolute price charts of crude oil and its distillates remain rangebound, a relative bid could go a long way toward supporting higher prices for these contracts.
Either way, the above chart suggests it could be time for healthy rotation back into energy.
—
Originally posted 3rd March, 2023
Disclosure: Investopedia
Investopedia.com: The comments, opinions and analyses expressed herein are for informational purposes only and should not be considered individual investment advice or recommendations to invest in any security or to adopt any investment strategy. While we believe the information provided herein is reliable, we do not warrant its accuracy or completeness. The views and strategies described on our content may not be suitable for all investors. Because market and economic conditions are subject to rapid change, all comments, opinions and analyses contained within our content are rendered as of the date of the posting and may change without notice. The material is not intended as a complete analysis of every material fact regarding any country, region, market, industry, investment or strategy. This information is intended for US residents only.
Disclosure: Interactive Brokers
Information posted on IBKR Campus that is provided by third-parties does NOT constitute a recommendation that you should contract for the services of that third party. Third-party participants who contribute to IBKR Campus are independent of Interactive Brokers and Interactive Brokers does not make any representations or warranties concerning the services offered, their past or future performance, or the accuracy of the information provided by the third party. Past performance is no guarantee of future results.
This material is from Investopedia and is being posted with its permission. The views expressed in this material are solely those of the author and/or Investopedia and Interactive Brokers is not endorsing or recommending any investment or trading discussed in the material. This material is not and should not be construed as an offer to buy or sell any security. It should not be construed as research or investment advice or a recommendation to buy, sell or hold any security or commodity. This material does not and is not intended to take into account the particular financial conditions, investment objectives or requirements of individual customers. Before acting on this material, you should consider whether it is suitable for your particular circumstances and, as necessary, seek professional advice.
Disclosure: ETFs
Any discussion or mention of an ETF is not to be construed as recommendation, promotion or solicitation. All investors should review and consider associated investment risks, charges and expenses of the investment company or fund prior to investing. Before acting on this material, you should consider whether it is suitable for your particular circumstances and, as necessary, seek professional advice.
Disclosure: Futures Trading
Futures are not suitable for all investors. The amount you may lose may be greater than your initial investment. Before trading futures, please read the CFTC Risk Disclosure. A copy and additional information are available at ibkr.com.

