


![[Gamma] Scalping Please](https://ibkrcampus.com/wp-content/smush-webp/2024/04/tir-featured-8-700x394.jpg.webp "[Gamma] Scalping Please")


By J.C. Parets & All Star Charts
Monday, 8th May, 2023
1/ Dr. Copper Ignores the Newsfeed
2/ Equities Indicate Potential for Lower Interest Rates
3/ Is It Time for Gold Miners to Shine?
4/ Staples Sector Warns Markets
Investopedia is partnering with All Star Charts on this newsletter, which both sells its research to investors, and may trade or hold positions in securities mentioned herein. The contents of this newsletter are for informational and educational purposes only, however, and do not constitute investing advice.
1/ Dr. Copper Ignores the Newsfeed
Dr. Copper remains buoyant amid rising concerns of an economic downturn. This is not necessarily what you would expect against a backdrop of bank failures and hawkish Fed policies.
That’s why we base our analysis on markets and price—not headlines, and certainly not the economy.
Here’s the daily chart of copper futures:

It’s not the cleanest chart, but most aren’t. We joke around about using crayons, not pencils, when marking levels on our charts. And the copper futures chart displays why.
Regardless, the chart provides plenty of insight. The August 2022 pivot high at approximately $3.80 marks a potential support level. A decisive break below that level would signal increased downside risks.
On the flip side, the November 2022 pivot high of roughly $3.96 highlights former resistance, as copper failed to take out that level last month.
Copper is surprisingly resilient despite the news cycle, but stock and commodity bulls likely want to see copper futures trading back above $4.00 sooner rather than later.
2/ Equities Indicate Potential for Lower Interest Rates
Some stocks tend to perform better than others in rising interest rate environments. Alternatively, there are also groups that we expect to lead when rates are low or falling.
The Equities For Rising Rates ETF (EQRR) was designed with exactly this in mind. EQRR holds mostly financials and energy stocks but also has exposure to other cyclical subgroups like industrial metals.
The idea is that this basket of stocks should perform well and show leadership during periods of rising interest rates. Here is the relative trend between EQRR and the SPDR S&P 500 ETF Trust (SPY), along with the yield on the 10-year U.S. Treasury note in the lower pane:
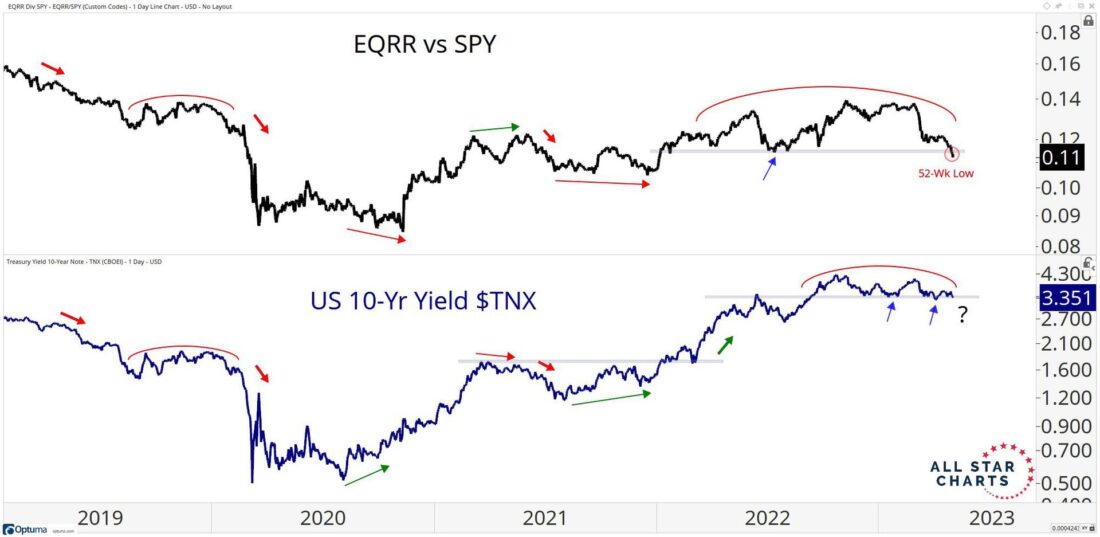
Notice the strong correlation that EQRR/SPY has with the 10-year, as these charts look quite similar. As rates have risen since 2020, EQRR has shown steady outperformance over the S&P 500.
However, with new 52-week lows from this ratio last week, the price action from these stocks is no longer supportive of a rising rate backdrop. In fact, with a year-long distribution pattern resolving to the downside, the ratio is suggesting that rates could roll over from here.
While U.S. yields are still holding on, a violation of the pivot lows would confirm what EQRR/SPY is telling us. We’re looking for a potential leg lower from rates in the near future.
3/ Is It Time for Gold Miners to Shine?
The Physical Gold ETF (GLD) posted a new all-time high on a weekly closing basis. But before we get ahead of ourselves, we would also want to witness gold futures print new highs.
Meanwhile, it appears that gold mining stocks could be gearing up for a rally relative to the broader market. Check out the Gold Miners ETF (GDX) vs. the S&P 500 (SPY) ratio overlaid with the Gold ETF (GLD):

A potential catch-up trade for the GDX/SPY ratio appears at first glance. But GDX’s relative strength largely depends on gold’s uptrend.
We doubt that GDX will outperform the broader market if gold trades below last month’s low. On the flip side, gold futures will likely fail to print new all-time highs if the GDX/SPY ratio rolls over. It works both ways.
For now, we are on the lookout for breakouts in the strongest gold mining stocks. But we’re also monitoring the GDX/SPY ratio for signs of a near-term reversal, indicating potential weakness for gold.
4/ Staples Sector Warns Markets
When the overall market is under pressure, consumer staples stocks tend to exhibit relative strength.
Due to their low volatility and defensive nature, these are the areas where investors like to hide when bears are in control.
Below we show the relative trend between the Equal Weight Consumer Staples Sector (RHS) and the Equal Weight S&P 500 (RSP):

As you can see, not only have staples stocks outperformed the broader market since February, but the ratio is pressing against the upper bounds of a bearish-to-bullish reversal pattern.
These former highs were the line in the sand during last year’s bear market. An upside resolution would be a significant warning that more losses could come for risk assets.
—
Originally posted 8th May 2023
Disclosure: Investopedia
Investopedia.com: The comments, opinions and analyses expressed herein are for informational purposes only and should not be considered individual investment advice or recommendations to invest in any security or to adopt any investment strategy. While we believe the information provided herein is reliable, we do not warrant its accuracy or completeness. The views and strategies described on our content may not be suitable for all investors. Because market and economic conditions are subject to rapid change, all comments, opinions and analyses contained within our content are rendered as of the date of the posting and may change without notice. The material is not intended as a complete analysis of every material fact regarding any country, region, market, industry, investment or strategy. This information is intended for US residents only.
Disclosure: Interactive Brokers
Information posted on IBKR Campus that is provided by third-parties does NOT constitute a recommendation that you should contract for the services of that third party. Third-party participants who contribute to IBKR Campus are independent of Interactive Brokers and Interactive Brokers does not make any representations or warranties concerning the services offered, their past or future performance, or the accuracy of the information provided by the third party. Past performance is no guarantee of future results.
This material is from Investopedia and is being posted with its permission. The views expressed in this material are solely those of the author and/or Investopedia and Interactive Brokers is not endorsing or recommending any investment or trading discussed in the material. This material is not and should not be construed as an offer to buy or sell any security. It should not be construed as research or investment advice or a recommendation to buy, sell or hold any security or commodity. This material does not and is not intended to take into account the particular financial conditions, investment objectives or requirements of individual customers. Before acting on this material, you should consider whether it is suitable for your particular circumstances and, as necessary, seek professional advice.
Disclosure: ETFs
Any discussion or mention of an ETF is not to be construed as recommendation, promotion or solicitation. All investors should review and consider associated investment risks, charges and expenses of the investment company or fund prior to investing. Before acting on this material, you should consider whether it is suitable for your particular circumstances and, as necessary, seek professional advice.
Disclosure: Futures Trading
Futures are not suitable for all investors. The amount you may lose may be greater than your initial investment. Before trading futures, please read the CFTC Risk Disclosure. A copy and additional information are available at ibkr.com.


Join The Conversation
If you have a general question, it may already be covered in our FAQs. If you have an account-specific question or concern, please reach out to Client Services.