


![[Gamma] Scalping Please](https://ibkrcampus.com/wp-content/smush-webp/2024/04/tir-featured-8-700x394.jpg.webp "[Gamma] Scalping Please")


Thursday, July 23, 2020
1. Massive sector rotation portends potential trouble ahead
2. Big tech took big hits today
3. AAPL faithful should prepare for the storm
Market Moves
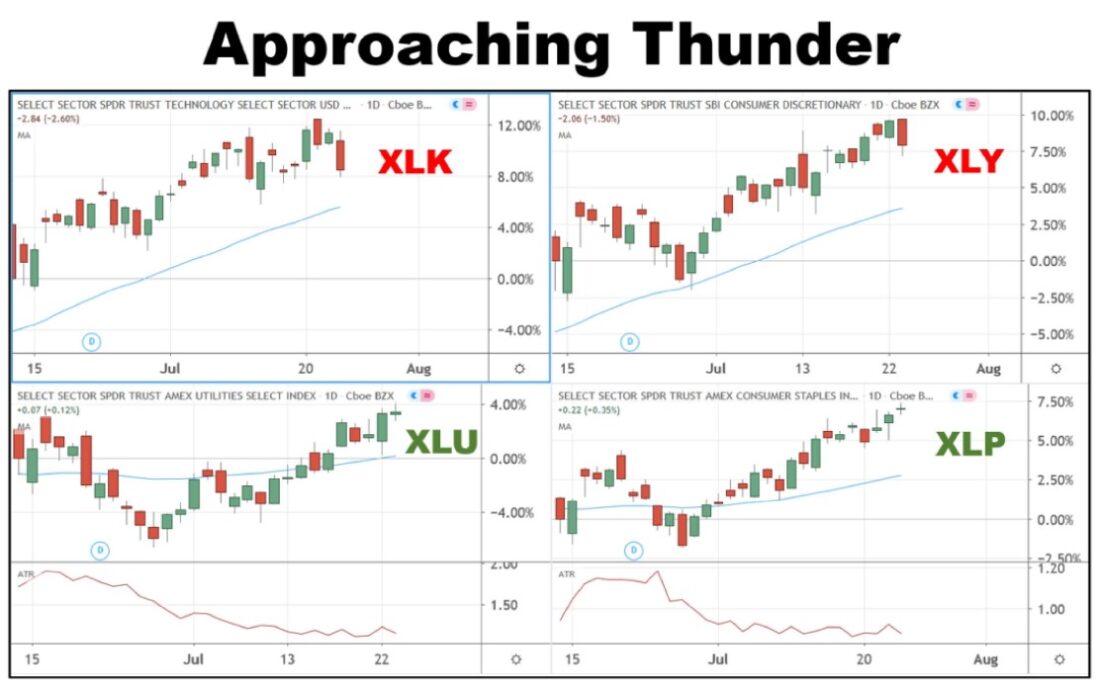
Most big tech stocks fell more than two-and-a-half percent today while bond and gold prices surged higher. This could mean trouble. However, even though the S&P 500 index (SPX) also fell, the Utility and Consumer Staples sectors actually rose (see chart below). This suggests that today’s moves were more likely the work of the portfolio management crowd implementing a sector rotation, rather than early signs of general market panic.
The reaction to the earnings report from Microsoft (MSFT) yesterday was a major clue. The report came in as very good news and yet investors sold shares heavily after hours. This kind of behavior is typical of professional investors who operate by the maxim “buy the rumor and sell the news.” What that notion describes is a tactic used by fund managers who need to unload their positions and move money to different stocks. During such times they often have a lot of shares to sell—too many to be sure they won’t hurt prices as they sell. To optimize their profit-taking activities, they try to find a time when the shares are likely to have a lot of buyers. What better time than when earnings are great and market sentiment seems to be strong?
However the timing of this strategy coincided with a moment when even retail investors were growing nervous (See Caleb Silver’s article from last week ). It seems many other traders and investors had the same idea. That means today’s price action might indicate that a perfect storm for big tech stocks is on the horizon.
Big Tech Took Big Hits Today
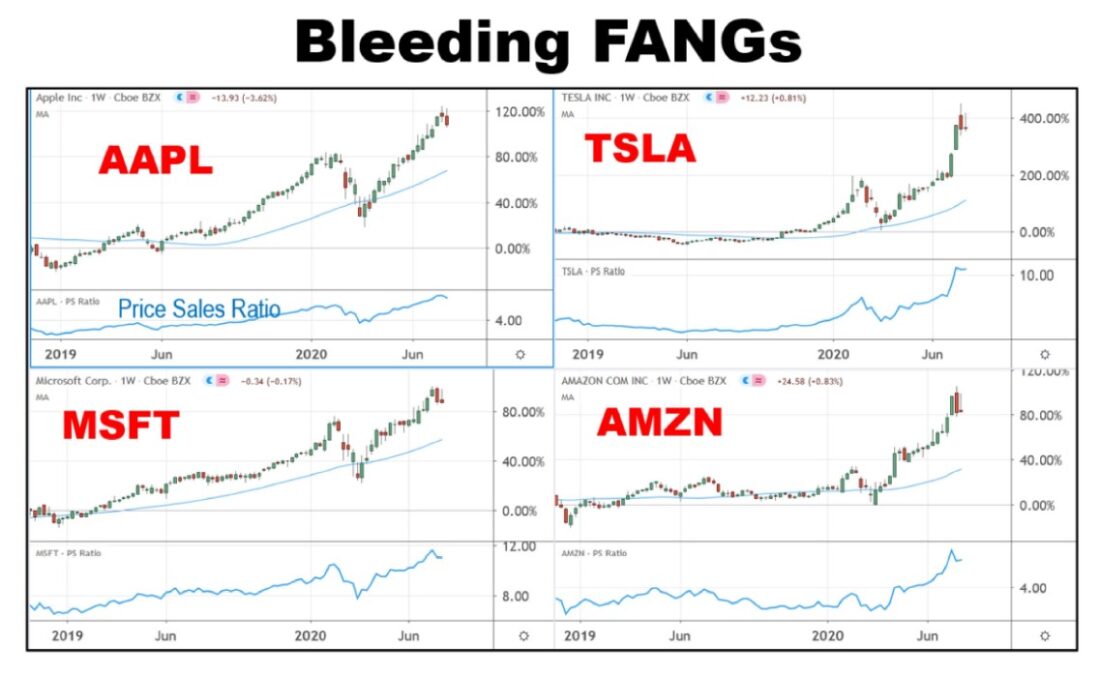
The chart below shows where the action was today. The four issues hit hardest by today’s selling are shown below: Apple (AAPL), Tesla (TSLA), Microsoft (MSFT), and Amazon (AMZN). Alphabet (GOOGL), Facebook (FB), and Netflix (NFLX), rounding out the FAANG stocks, could also have been included because their action was similar.
This chart gives a snapshot of those four stocks week-by-week over the past 18 months. Those big red candles on the right-most part of each chart show that today’s action isn’t an isolated incident. The selling has been going on for more than a week in most cases, though today it accelerated. Each of these stocks had a news headline associated with it selling, but the reality is that the selling was in the works long before the news broke.
The lower pane of each stock in the chart below (click for a magnified view) is a simplified look at what is causing the drive to sell. It is a line depicting the Price-to-Sales Ratio. While there are often many variables in most analysts’ valuation models, this single fundamental indicator seems to be capturing the bottom line of all of them: stock valuations are near their highest in over a decade, and fund managers just can’t see hanging around any longer.
AAPL Faithful Should Prepare for the Storm
There is a good possibility that AAPL shares could rebound strongly and get back on track after earnings are announced. However, the indications mentioned above make that seem less likely each day. Those who are committed to buying and holding AAPL shares for the long haul should understand what they are in for and plan accordingly.
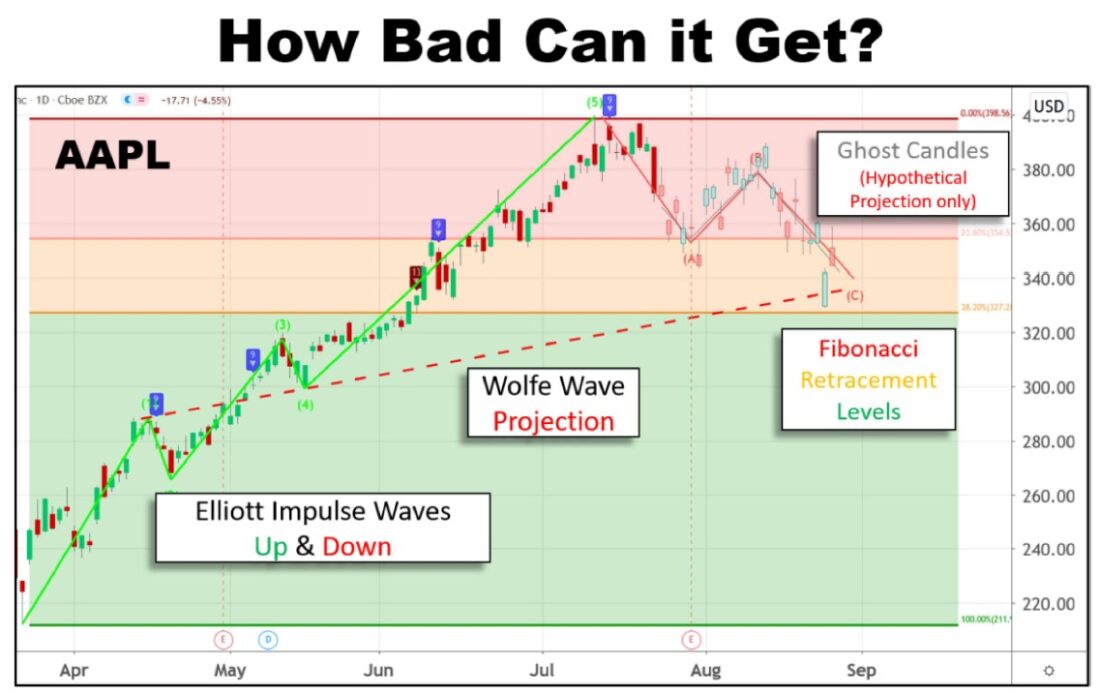
When fundamental measures cannot tell you where the price of the stock will surely go, technical measures offer the next best source for an educated guess. The chart below uses TD Sequential turning points, Fibonacci retracement levels, Elliott wave and Wolfe wave studies to create a hypothetical look at the future. It is unlikely that Apple will completely fall apart as a company, however the shares could easily retreat by 20 to 25 percent before investors feel optimistic about its growth prospects again.
The Bottom Line
Big tech company stocks fell strongly as money seemed to rotate out of growth-heavy sectors and into safer havens such as Utilities and Consumer Staples stocks. The so-called FAANG stocks shed two to four percent each today, and the price action on AAPL suggests the selling may not be over.
—
Originally Published on July 23, 2020
Disclosure: Investopedia
Investopedia.com: The comments, opinions and analyses expressed herein are for informational purposes only and should not be considered individual investment advice or recommendations to invest in any security or to adopt any investment strategy. While we believe the information provided herein is reliable, we do not warrant its accuracy or completeness. The views and strategies described on our content may not be suitable for all investors. Because market and economic conditions are subject to rapid change, all comments, opinions and analyses contained within our content are rendered as of the date of the posting and may change without notice. The material is not intended as a complete analysis of every material fact regarding any country, region, market, industry, investment or strategy. This information is intended for US residents only.
Disclosure: Interactive Brokers
Information posted on IBKR Campus that is provided by third-parties does NOT constitute a recommendation that you should contract for the services of that third party. Third-party participants who contribute to IBKR Campus are independent of Interactive Brokers and Interactive Brokers does not make any representations or warranties concerning the services offered, their past or future performance, or the accuracy of the information provided by the third party. Past performance is no guarantee of future results.
This material is from Investopedia and is being posted with its permission. The views expressed in this material are solely those of the author and/or Investopedia and Interactive Brokers is not endorsing or recommending any investment or trading discussed in the material. This material is not and should not be construed as an offer to buy or sell any security. It should not be construed as research or investment advice or a recommendation to buy, sell or hold any security or commodity. This material does not and is not intended to take into account the particular financial conditions, investment objectives or requirements of individual customers. Before acting on this material, you should consider whether it is suitable for your particular circumstances and, as necessary, seek professional advice.


![[Gamma] Scalping Please](https://ibkrcampus.com/wp-content/smush-webp/2024/04/tir-featured-8-300x169.jpg.webp "[Gamma] Scalping Please")