


![[Gamma] Scalping Please](https://ibkrcampus.com/wp-content/smush-webp/2024/04/tir-featured-8-700x394.jpg.webp "[Gamma] Scalping Please")


Portfolio Manager Greg Kuhl explains why some areas of commercial real estate are likely to face distress in the coming months and the advantages of public versus private real estate in this environment.
Key takeaways:
- Recent signs of stress in the banking system are likely to lead to tighter credit conditions, reducing credit availability and widening credit spreads.
- This will likely put stress on the commercial real estate sector given it is mainly owned by private real estate entities, which rely heavily on debt markets for funding.
- Public real estate appears well positioned as credit tightens, given typically lower leverage, wider access to capital and lower exposure to office. Additionally, public valuations have already repriced significantly compared to lagging reported values for private.
In recent weeks, we have observed the impact of one of the most aggressive ever US Federal Reserve (Fed) tightening campaigns, manifesting itself via signs of stress in the banking system. So far, that includes the second and third-largest bank failures in US history, and the end of Credit Suisse, a 165-year-old global banking institution. It would seem logical to conclude that following such events, we can expect conditions across the financial system to tighten. This has already been evidenced by certain indicators. The Bloomberg US Financial Conditions Index, for example, was showing financial conditions slightly looser than average on 8 March (immediately before the bank failures), but on 20 March indicated conditions about 40% tighter than average.1 Whether these bank failures are idiosyncratic (endemic) or mark the end of a credit cycle will only be known in hindsight, but our team’s current expectation is for less availability of credit and wider credit spreads in the near to medium term.
How will weaker credit markets impact commercial real estate?
About 90% of commercial real estate (CRE) is privately owned, and most private commercial real estate owners finance their properties using mainly debt (with the average CRE loan since 2011 at about 64% loan-to-value, LTV).2 Because of this, the cost and availability of credit are important drivers of the overall health and valuation levels of the CRE market.
In the coming months, we expect an increase in the number of headlines and the general level of concern around stress in commercial real estate markets, primarily related to the following debt market transmission mechanisms:
1) Existing CRE loans could default due to technical or operational factors, potentially leading to interruption of interest payments and forced asset sales.
2) New CRE loans, including refinancing of maturing CRE debt, is likely be underwritten on lower loan-to-value ratios, demanding higher coupons, and generally with less availability, leading to a reduction or elimination of equity for borrowers who are refinancing. This would force new acquisitions to take place at lower prices to enable equity sponsors to hit their return targets.
Similar assets, different characteristics
Having laid out a framework for how credit markets can impact the commercial real estate market, we think it is crucial to also highlight some very important differences between public real estate (listed real estate investment trusts or REITs) and private real estate (non-traded REITs, private equity):
- Relatively lower leverage: Public real estate uses about half as much leverage as private real estate with public REITs currently capitalised at about 30% loan-to-value,3 compared to privately owned CRE, which has been borrowing at about 64% LTV this cycle. As measured by Debt/EBITDA (a metric we prefer because it removes any subjectivity from the ‘V’ in loan-to-value), public real estate leverage levels are currently as low as they have ever been (figure 1). At the same time, public real estate term-to-debt maturity is just about as long as it has ever been, at an average of seven years. We think with less overall leverage and less exposure to debt refinancing, public REITs generally have relatively lower risk compared to private real estate.
Figure 1: Financial strength now a key characteristic of public REITs
US REIT Debt/EBITDA, US REIT Average Debt Maturity
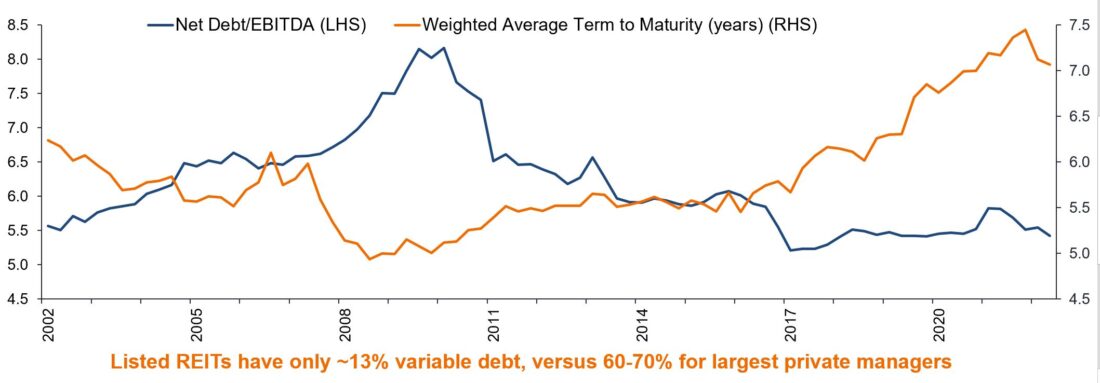
Source: NAREIT, S&P Financial, Janus Henderson Investors analysis, as at Q3 2022. Citi Research data for variable debt as at 13 December 2022. Past performance does not predict future returns.
Office is only a small proportion of public REITs: ‘Commercial real estate’ is overly broad terminology. CRE is made up of at least 16 different property types, many of which have healthy fundamentals that we would expect to remain durable even in a downturn, as they have historically. One notable exception to this is office, especially lower quality office, where there are notable headwinds. Three years out from the onset of the pandemic, office attendance in the US remains at 50% of pre-COVID levels.4 We think this is a bad omen for future occupancy and rent levels as leases mature and corporate office tenants reassess real estate spending, especially if leases are maturing into a weaker economic environment. By some estimates, the values of office buildings are today around 25-30% below pre-pandemic levels, with class B and C offices faring worse than this.5 If these estimates are accurate, office loans that were originated in prior years at more than 60% LTV are going to come under significant scrutiny or potentially default. Office as a sector is likely to be more difficult and costly to finance going forward. Office loans make up about 16% of bank lending to CRE 6 and a material percentage of privately-owned CRE exposure.
We believe any forthcoming distress in commercial real estate is likely to be heavily dominated by office, a sector that is just 6% of US REITs’ market capitalisation. Office exposure can be adjusted by active public real estate managers as they are able to respond to and take advantage of changing market conditions.
Figure 2: Office sector constitutes only 6% of US REIT universe
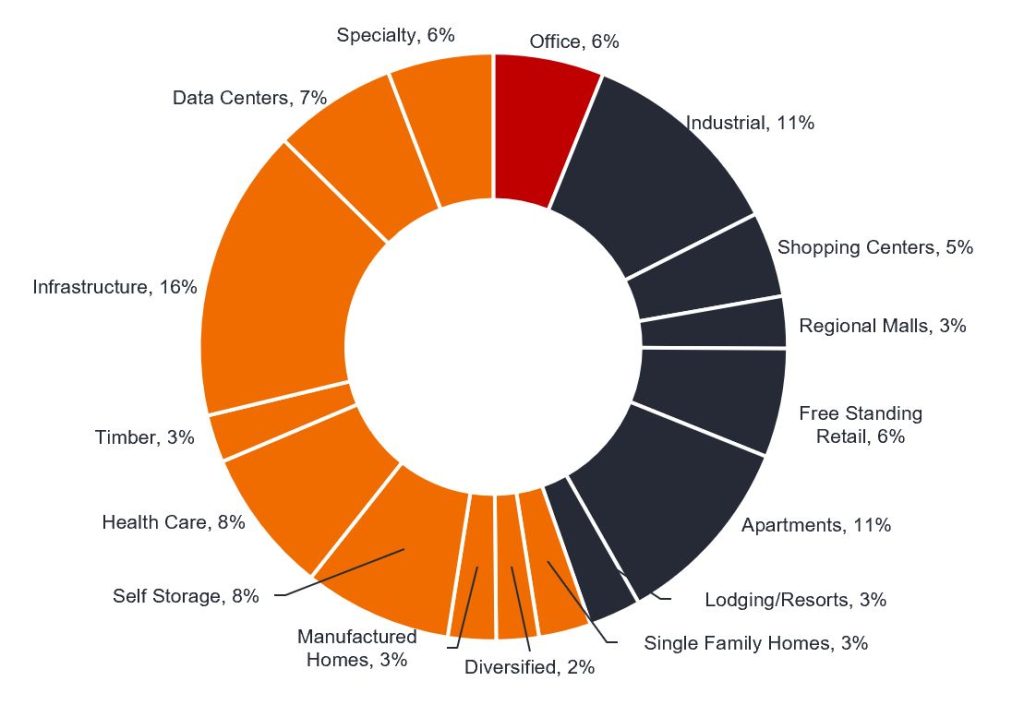
Source: Janus Henderson Investors, FTSE, US REITs = FTSE Nareit All Equity REITs Index as at 31 January 2023.
- Wider access to capital: When credit market conditions tighten, access to capital becomes more important. Both public and private real estate owners can borrow via bank loan and commercial mortgage-backed securities (CMBS) markets. Public real estate companies can also issue publicly-traded bonds, with the majority of public REITs being investment grade borrowers within the unsecured debt markets. We are not aware of any non-traded REITs that have accessed the unsecured debt markets but they remain open for high-quality public REITs. In the nine trading days following Silicon Valley Bank’s failure up to the time of writing, two public REITs, Extra Space Storage (EXR) and Prologis (PSA), accessed the unsecured debt markets for a total of $1.7bn with an average maturity of 14 years at a blended coupon of 5.16%.7 These coupons are significantly lower compared to a few months ago. Public REITs can also source equity via overnight public offerings to the stock market, while private real estate owners have a fund-raising process that is more complex, making it much slower. In the current environment, funding is typically more difficult given many of the largest private real estate funds are currently ‘gated’ and limiting redemptions.8
- Private valuation lag: As discussed in a previous post, public real estate markets have priced in the various headwinds associated with the Fed’s ongoing rate-hiking campaign, with US REITs having declined by 25% since the start of 2022.9 Private real estate, where managers self-report valuations, reported a 7.5% increase in value since the start of 2022.10 Public real estate is re-priced by public equity investors approximately 250 times per year, every day the stock market is open. In contrast, private real estate is repriced four to 12 times per year and managers have discretion over reported valuations.
While future headlines may focus on declining real estate values and CRE “distress”, investors should keep in mind that since 90% of commercial real estate is privately held, most of these headlines will reference values reported by private managers. It is also crucial to remember that public real estate was already repriced significantly during 2022 and private real estate was not. Reported private real estate values have tended to follow public real estate values with a lag – public markets have already experienced what private real estate is likely to go through.
Public REITs are well positioned ahead of tighter credit conditions
Tighter credit markets make the investing landscape more challenging. They also tend to expose riskier capital structures for what they are. Public real estate companies typically operate with half the leverage of private, have minimal exposure to near-term debt maturities, and enjoy access to more forms of debt and equity capital than other types of real estate ownership. Public companies have also already experienced much of the ‘distress’ that we could be hearing when private real estate owners are finally forced to take write downs. There will surely be more volatility ahead, but public real estate investors should take comfort that listed REITs appear as well positioned as they have ever been heading into a period of tighter credit conditions. With their typically relatively lower leverage and wider access to capital, we think public REITs may find themselves in a position to go “on offense” and take advantage of distressed asset sales from private real estate owners. Not all forms of commercial real estate ownership are created equal; we believe the time for public REITs to capitalise on their many advantages is coming.
Sources
Bloomberg as at 20 March 2023. Bloomberg US Financial Conditions Index indicates a z score of -1.3, which equates to 40% below average in the normal distribution framework which the index uses.
Morgan Stanley Research REITs/CRE note 16 March 2023, data to 31 December 2022.
Green Street Advisors, data to 17 March 2023, market cap weighted net leverage.
Kastle Back to Work Barometer.
Green Street Advisors, Commercial Property Price Index February 2023, Green Street 2023 Office Outlook.
BofA Securities as at 23 March 2023.
Bloomberg, Janus Henderson Investors as at 20 March 2023.
Barrons.com, Blackstone Limits BREIT Withdrawals for Fourth Straight Month, 1 March 2023.
Bloomberg, FTSE NAREIT Equity REITs Index returns in US dollars, 31 December 2021 to 20 March 2023.
ODCE Index returns in US dollars, 31 December 2021 to most recent available data at 31 December 2022.
Definitions
Credit cycle: describes the level of access to credit or funding for households and companies and consists of four phases: expansion, downturn, repair and recovery.
Credit spread: the borrowing rate in excess of risk-free government bonds required by lenders to make loans to private entities.
CMBS: commercial mortgage-backed securities are a type of fixed-income security created by banks by bundling a group of commercial real estate loans, which are rated according to risk then sold to investors.
Debt/EBITDA: the ratio of total debt to earnings before interest on loans, income tax, depreciation and amortisation (EBITDA). The higher the value of the indicator, the greater the level of debt load and the risk of failure to fulfil the company’s financial obligations.
Equity sponsor: takes on responsibility for all aspects of a commercial real estate project on behalf of the equity investors, including achievement of a target return.
Investment grade rating: awarded to a bond or portfolio of bonds/debt that are deemed to have higher credit ratings and as such a relatively low risk of defaulting on their payments.
Leverage: the amount of debt that a REIT carries. The leverage ratio is measured as the ratio of debt to total assets.
Loan-to-Value (LTV) ratio: calculated by dividing property loan amount by the property value. Used by lenders to assess the level of risk exposure when underwriting a loan/debt.
Loose/tight financial conditions: financial conditions reflect the price of risk in an economy. Loose financial conditions provide a greater incentive to take on more risk and a greater capacity to lend, while in tight conditions there is less incentive to take on more risk, reducing the capacity to lend.
Tight credit market: when availability of loans is reduced, often coupled with stricter borrowing conditions.
Unsecured debt: debt that is not backed by any asset or collateral, therefore there is a higher risk of default risk, which is reflected in higher interest rates to compensate lenders.
Volatility: the rate and extent at which the price of a portfolio, security or index, moves up and down.
Bloomberg Financial Conditions Index (BFICUS) provides a daily statistical measure of the relative strength of the US money markets, bond markets, and equity markets, providing a gauge of the overall conditions in US financial and credit markets.
FTSE Nareit Equity REITs Index contains all equity REITs not designated as timber REITs or infrastructure REITs. The FTSE Nareit US Real Estate Index Series is designed to present investors with a comprehensive family of REIT performance indexes that spans the commercial real estate space across the US economy.
ODCE Index is a core capitalisation-weighted index that includes only unlisted (private) open-end diversified core strategy funds with at least 95% of their investments in US markets.
—
Originally Posted March 27, 2023 – Commercial property in the headlines: Advantages of public versus private real estate as credit tightens
Disclosure: Janus Henderson
The opinions and views expressed are as of the date published and are subject to change without notice. They are for information purposes only and should not be used or construed as an offer to sell, a solicitation of an offer to buy, or a recommendation to buy, sell or hold any security, investment strategy or market sector. No forecasts can be guaranteed. Opinions and examples are meant as an illustration of broader themes and are not an indication of trading intent. It is not intended to indicate or imply that any illustration/example mentioned is now or was ever held in any portfolio. Janus Henderson Group plc through its subsidiaries may manage investment products with a financial interest in securities mentioned herein and any comments should not be construed as a reflection on the past or future profitability. There is no guarantee that the information supplied is accurate, complete, or timely, nor are there any warranties with regards to the results obtained from its use. Past performance is no guarantee of future results. Investing involves risk, including the possible loss of principal and fluctuation of value.
Disclosure: Interactive Brokers
Information posted on IBKR Campus that is provided by third-parties does NOT constitute a recommendation that you should contract for the services of that third party. Third-party participants who contribute to IBKR Campus are independent of Interactive Brokers and Interactive Brokers does not make any representations or warranties concerning the services offered, their past or future performance, or the accuracy of the information provided by the third party. Past performance is no guarantee of future results.
This material is from Janus Henderson and is being posted with its permission. The views expressed in this material are solely those of the author and/or Janus Henderson and Interactive Brokers is not endorsing or recommending any investment or trading discussed in the material. This material is not and should not be construed as an offer to buy or sell any security. It should not be construed as research or investment advice or a recommendation to buy, sell or hold any security or commodity. This material does not and is not intended to take into account the particular financial conditions, investment objectives or requirements of individual customers. Before acting on this material, you should consider whether it is suitable for your particular circumstances and, as necessary, seek professional advice.
Disclosure: Alternative Investments
Alternative investments can be highly illiquid, are speculative and may not be suitable for all investors. Investing in Alternative investments is only intended for experienced and sophisticated investors who have a high risk tolerance. Investors should carefully review and consider potential risks before investing. Significant risks may include but are not limited to the loss of all or a portion of an investment due to leverage; lack of liquidity; volatility of returns; restrictions on transferring of interests in a fund; lower diversification; complex tax structures; reduced regulation and higher fees.

