


Following the latest CPI and PPI data, it seems even more clear that inflation mostly peaked around June/July last year and has been easing since, particularly in the last six months. This note follows up on the comments I made back in December, highlighting the influence of shelter costs and the Fed’s potential response to the latest data.
The slowdown in inflation is visible in the year-on-year change in the CPI, but a key reason this is not as clear as it should be in the CPI data is the way shelter (rent/housing) costs are calculated, which basically incorporates a significant lag (around 12 months on average) in shelter costs relative to measures of current market prices.
As we discussed previously, there is of course a reason why the CPI has always been calculated this way: the average person does not re-sign a lease or move house every month, and thus does not see their current monthly rent (directly or imputed) move around with current market rents. So while the CPI’s methodology is arguably more realistic for an average consumer’s experience (setting aside issues of how “owner’s equivalent rent” itself is calculated), it is much less useful for forward-looking inflation policy discussions given the lags involved, particularly in times like these when inflation (and most economic data) is very volatile.
And of course, the Fed knows this.
So while the usual adjustment to CPI stats has been to exclude the volatile food and energy components, I have been more focused on the CPI ex Shelter readings, and then watching other data series to gauge the current prices for houses and rents.
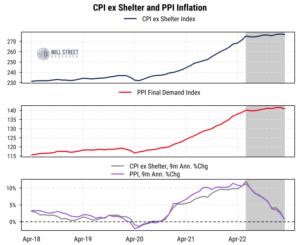
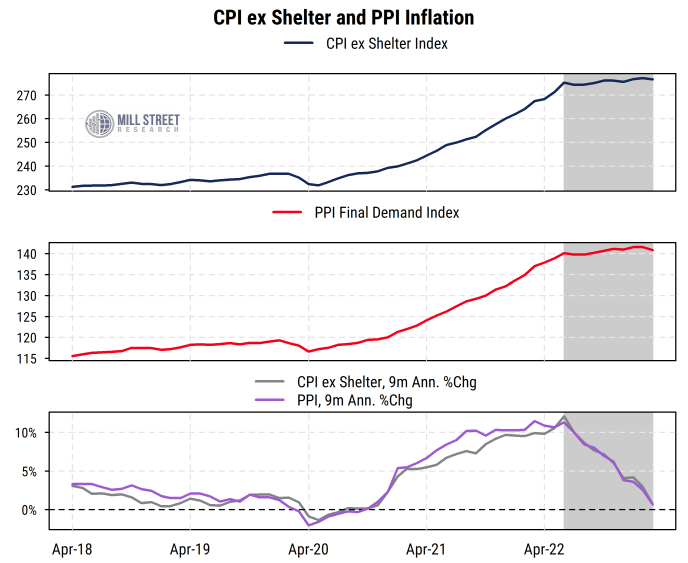
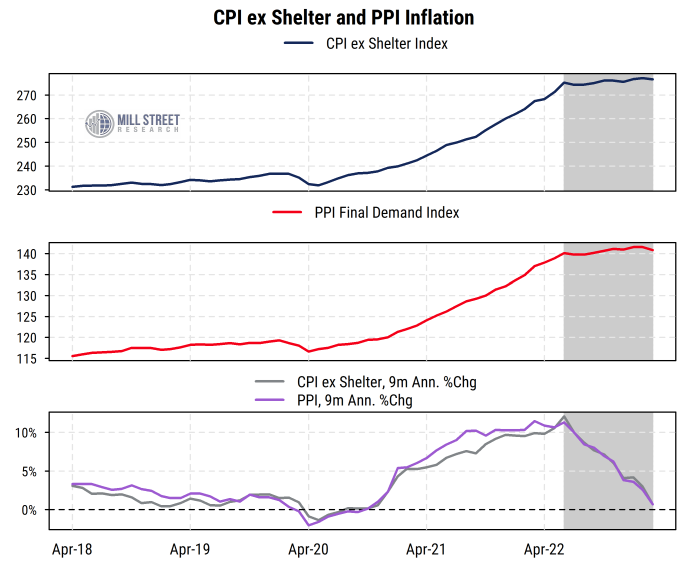
CPI ex Shelter and PPI both show 9-month inflation near zero
CPI for all items ex Shelter is now only up 3.4% from a year ago, and up only 0.5% from its level in June, i.e., a 9-month annualized growth rate of just 0.7%. That is, only the extreme data for the three months of March-May 2022 are responsible for keeping the year-on-year CPI ex-Shelter inflation rate above target.
I have also been watching the PPI data, which is “wholesale” or business-level inflation and does not include consumer housing costs. While the PPI is typically more volatile than the CPI, it has shown a similar clear halt in inflation after June of last year. The PPI for Final Demand is now up just 2.8% from a year ago, and is up just 0.5% since June, just like the CPI ex Shelter.
Source: Mill Street Research, Bureau of Labor Statistics
Basically there has been no inflation at the business/wholesale level or in overall consumer prices ex shelter since June (shaded period in chart above), a clear sign that tighter policy and improved supply chains have had a big effect already.
“Supercore” is too narrow and less impacted by monetary policy
Fed Chair Jay Powell has mentioned an even more narrow CPI metric many now call “supercore”: only services (no goods) excluding food, energy, and shelter (housing/rent is considered a “service”). That figure only accounts for about 28% of the overall CPI and is primarily made up of out-of-pocket medical care costs, transportation costs like insurance and maintenance (i.e., not including actual vehicle purchases), recreation services (tickets to events, cable TV, etc.), and education (tuition/school fees).
That supercore services figure is heavily influenced by labor costs as well as things less sensitive to demand changes (medical services, health and car insurance, education, etc.). So while it is true that those areas may be more sensitive to the worries about tight labor markets driving inflation, they are also among the areas least likely to be directly influenced by monetary policy (higher interest rates).
Housing/rent prices clearly slowing since June
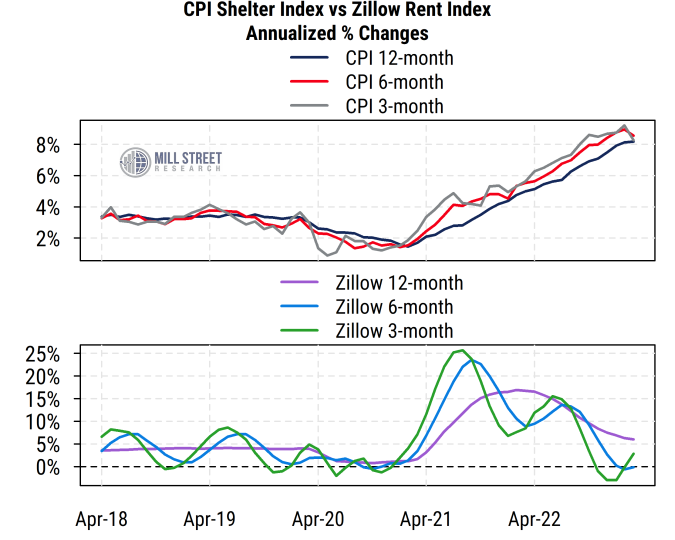
The part of the economy that is most sensitive to interest rates is of course housing. And there we have seen a direct impact of the Fed’s tightening, and home prices and rents basically stopped going up in Q3 last year. The Case-Shiller National Home Price index peaked in June and even through January (the data is lagged) was down 3% from that peak. It is up only 3.8% from a year ago, not the 8% that the CPI Shelter index shows.
Source: Mill Street Research, Bureau of Labor Statistics, Zillow
The Zillow Rent Index reflected in the charts above and below, peaked in September and through March is basically unchanged since then. It is up 6% from a year ago, all of which occurred before September.
Source: Mill Street Research, S&P CoreLogic Case-Shiller, Zillow
So the overall message is that inflation outside of shelter costs has been near (or even below) the Fed’s target for 6-9 months now, and more current rent and home price data show that shelter costs have been broadly flat over the last 6-8 months. Combining these two trends over the period of the last 6-8 months when the Fed has been aggressively tightening policy strongly suggests that inflation has already reached the Fed’s general target range, and only the most lagged data is still holding up the traditional headline numbers.
By the time we see the inflation data for June or July, it will likely be obvious that inflation has come back down to more normal levels (barring some new major supply shock).
Fed messaging shifting toward a pause after May
The recent messaging from Fed officials seems to be reflecting this to some degree: it has been shifting toward “one more hike in May and then pause to see how things develop”, while allowing some of the more hawkish members to say “more needs to be done” or “we cannot let up the inflation fight” without being too specific about it. The Fed remains heavily focused on maintaining its perception as the lead inflation fighter, even if the tools it has are more limited than most assume in the presence of supply-related issues.
If the recession that many are talking about, including some Fed staff apparently, does look like it is developing later this year, then talk of rate cuts will grow further. I do not see a recession imminent, but real growth is fairly low already, so seeing growth near zero or modestly negative is not out of the question as the year progresses. There remains a reasonable probability of a “soft landing” that would avoid a meaningful recession in the next year or so, and I would expect that any recession would be mild relative to past cycles, and that the Fed would reverse course fairly quickly once the headline inflation data is at or below target.
—
Originally Posted April 24, 2023 – Inflation continues to decelerate rapidly
Disclosure: Mill Street Research
Source for data and statistics: Mill Street Research, FactSet, Bloomberg
This report is not intended to provide investment advice. This report does not constitute an offer or solicitation to buy or sell any securities discussed herein in any jurisdiction where such offer or solicitation would be prohibited. Past performance is not a guarantee of future results, and no representation or warranty, express or implied, is made regarding future performance of any security mentioned in this report.
All information, opinions and statistical data contained in this report were obtained or derived from public sources believed to be reliable, but Mill Street does not represent that any such information, opinion or statistical data is accurate or complete. All estimates, opinions and recommendations expressed herein constitute judgments as of the date of this report and are subject to change without notice.
Disclosure: Interactive Brokers
Information posted on IBKR Campus that is provided by third-parties does NOT constitute a recommendation that you should contract for the services of that third party. Third-party participants who contribute to IBKR Campus are independent of Interactive Brokers and Interactive Brokers does not make any representations or warranties concerning the services offered, their past or future performance, or the accuracy of the information provided by the third party. Past performance is no guarantee of future results.
This material is from Mill Street Research and is being posted with its permission. The views expressed in this material are solely those of the author and/or Mill Street Research and Interactive Brokers is not endorsing or recommending any investment or trading discussed in the material. This material is not and should not be construed as an offer to buy or sell any security. It should not be construed as research or investment advice or a recommendation to buy, sell or hold any security or commodity. This material does not and is not intended to take into account the particular financial conditions, investment objectives or requirements of individual customers. Before acting on this material, you should consider whether it is suitable for your particular circumstances and, as necessary, seek professional advice.

Join The Conversation
If you have a general question, it may already be covered in our FAQs. If you have an account-specific question or concern, please reach out to Client Services.