


![[Gamma] Scalping Please](https://ibkrcampus.com/wp-content/smush-webp/2024/04/tir-featured-8-700x394.jpg.webp "[Gamma] Scalping Please")


As we start 2023, every asset class is experiencing its own version of adjustment. Part of that adjustment regards looking forward to a possible recession—likely at least part of the reason why valuations in many places dropped so significantly during 2022. Part of that adjustment includes an expectation that the US Federal Reserve (Fed) is unlikely to raise its policy rate further another 400 basis points (or more). Part of that adjustment includes expectations for a moderation of inflation, which is already coming down on many measures, at least for those of us looking at the US economic picture.
The performance evolution of new economy real estate
In Figure 1, we plotted a ratio of the cumulative return of the CenterSquare New Economy Real Estate UCITS Index (New Economy Real Estate) versus the MSCI ACWI Index (Global Equities). Whilst it sounds complicated, operationally speaking:
- if the chart is sloping downward from left to right, that tells us New Economy Real Estate is underperforming Global Equities
- if the chart is sloping upward from left to right, this tells us that New Economy Real Estate is outperforming Global Equities
To help in simplifying matters, we marked out six periods defined by the slope of the line, with the specific dates defined after Figure 1. Our rationale is simply that many global investors are considering a Global Equity benchmark and thinking about whether certain strategies—in this case one focused on New Economy Real Estate—can enter a trend of sustained outperformance.
Our main thesis is that there is potential for New Economy Real Estate companies to offer a differentiated way to have ‘tech exposure’ when people may be looking to dial back their exposure to general tech companies.
Figure 1: Evolution of performance of New Economy Real Estate vs. Global Equities
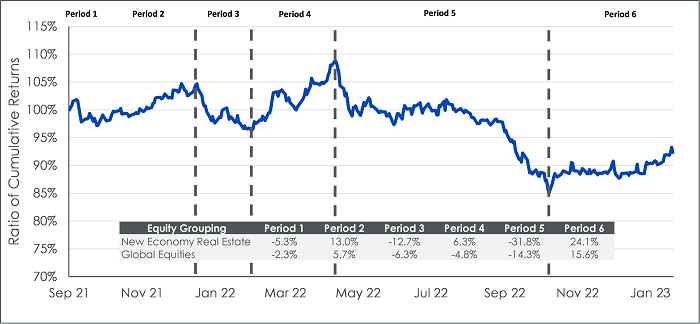
Source: Bloomberg. Full period is from 15 September 2021 to 3 February 2023, the period of live history for the CenterSquare New Economy Real Estate UCITS Index. Period 1: 15 September 2021 to 8 October 2021; Period 2: 8 October 2021 to 29 December 2021; Period 3: 29 December 2021 to 14 February 2022; Period 4: 14 February 2022 to 22 April 2022; Period 5: 22 April 2022 to 21 October 2022; Period 6: 21 October 2022 to 3 February 2023.
Historical performance is not an indication of future performance and any investments may go down in value.
Segments of New Economy Real Estate
But we can drill down, specifically to look at three specific areas in real estate. WisdomTree works with CenterSquare, an asset manager with deep experience and expertise in real estate, to define an approach to ‘New Economy Real Estate’, which focuses on:
- Cell towers
- Data centres
- Industrial warehouses tilting more in the direction of ecommerce and technology
While one can never know exactly how a given business or area of a market will respond in difficult economic conditions, there is a rationale to believe that it’s at least possible that these areas within real estate could tend to be more resilient than general real estate more broadly.
Relating to the well-known ‘pandemic pull-forward’
When we say ‘pull-forward’, we specifically mean how the world, in short order, was forced to adjust to an environment where office work shifted from going to a specific location each day to working from home and, ultimately, working from anywhere. To make this work, many people and many companies bought a lot of new hardware. Those purchases would have largely occurred during 2020 and are unlikely to be immediately replaced or even repurchased at quite the same scale as during that very unique time in our history.
Looking at cell towers in this context, one word tends to come up: ‘resilience’. Now, if the goal is to find what should provide the greatest sensitivity in an upward-trending market, cell towers are not likely to fit the bill. They tend to operate under more long-term leases with stable, predictable cash flows. Cell towers are not expected to have wide swings in their perceived value, whether in the upward or downward directions. When considering what type of force could drive value within cell towers, it’s more important to recognise the current 5G spending cycle that carriers are involved in. Any spending related to this was more aligned with the need to generally upgrade systems due to client demand to be able to deal with more data, faster, and this trend marches forward, seemingly without regard for either economic or pandemic-related conditions.
Data centres, on the other hand, did see a massive pull-forward. Logically, this makes sense, in that if people really did buy all that hardware and then did start working from their homes (and ultimately from anywhere), data centres needed to have the capacity to support the various productivity applications (like Zoom Video Communications or Microsoft Teams) at the vastly increased levels of demand. If we look at the recent past quarters of activity, 5 out of 6 saw all-time records in terms of the domestic uptake of space for data centres1. It would be impossible to expect this type of trend to continue indefinitely, but it is important to remember that even if there is a moderation, people aren’t demanding to use less data, and such a thing is not expected in the foreseeable future.
Valuations corrected significantly during 2022
We recognise that many investors may not be regularly tracking different valuation metrics for real estate, much less tracking the metrics that define specific underlying types of real estate. Stepping back for a moment, we should define some of the statistics that we believe are appropriate to contextualise the different types of real estate we are about to drill down on:
- For cell phone tower real estate investment trusts (REITs) and for REITs involved in logistics on the industrial side, we look at price / adjusted funds from operations (P/AFFO) over the next 12-months (NTM). The adjusted funds from operations is a way to see a measure of the cash flows available to shareholders in the REIT, as well as providing a sense of the REIT’s future potential to pay dividends.
- For data centre REITs, we look at the relationship between enterprise value to earnings before interest, taxes, depreciation, and amortisation over the coming 12-months—typically termed ‘next 12 months’ (EV/EBITDA NTM).
As is always the case, there is no perfect measure and nothing we can look at that tells us the coming period’s returns with certainty, but we believe that these metrics give the fairest view of these particular parts of the real estate market.
Looking at Figure 2a:
- The 5-year average P/AFFO Multiple NTM was 24.7x, looking at three very large operators. Each of those operators is now tracking below this level by this metric, after starting 2022 with all three trading above this average level.
- When looking at cell phone tower REITs, it’s important for investors to remember that many of the deals related to the underlying cash flows are set for long periods of time. The dominant factor influencing the market is more likely to be the transition of the world from 4G LTE standards to 5G standards, which is a massive investment for the wireless providers. The macroeconomic environment matters, but the pull from all angles to be able to process and transmit more data, faster, is inexorable.
Figure 2a: Cell phone tower REITs
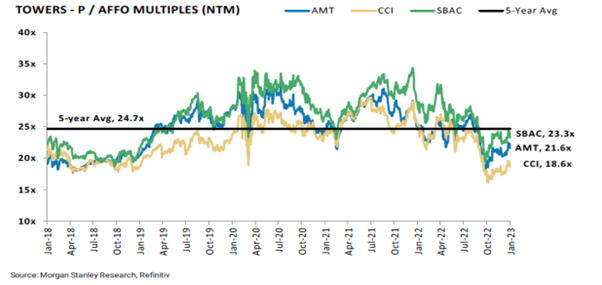
Sources: Morgan Stanley Research, Refinitiv, as compiled by CenterSquare in January 2023. SBAC: SBA Communications Corp. AMT: American Tower Corp. CCI: Crown Castle Incorporated.
Historical performance is not an indication of future performance and any investments may go down in value.
Looking at Figure 2b:
- We’d start any commentary on data centre REITs by admitting that those waiting for these assets to be ‘cheap’ on a valuation basis may have a long time to wait. Looking at two large operators, we see that the 10 year average EV/EBITDA Multiple (NTM) was 17.8x. Equinix corrected, but still trades above this figure. Digital Realty Trust also corrected, and it also still trades above this level.
- Similar to what we have said about cell phone towers, there are forces here that pull the valuations higher that are independent of the macroeconomic picture. People and businesses are both using and storing more data. A lot of the hype about artificial intelligence has to do with excitement around being able to process this data. Even if economic growth has been slowing in many corners of the globe, the generation and processing of data has not been slowing. We’d note, however, that neither DLR or EQIX are trading near where they were on a valuation basis in 2020 and 2021.
Figure 2b: Data centres
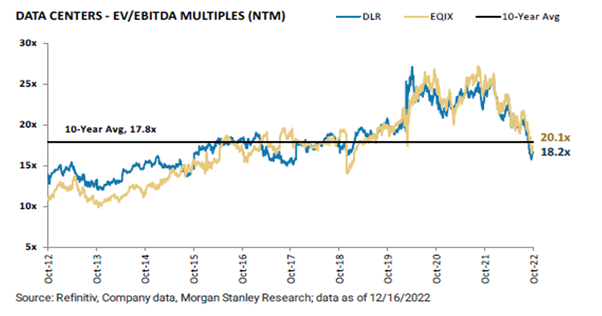
Sources: Refinitiv, Company Data, Morgan Stanley Research; data as of 16 December 2022 and compiled by CenterSquare in January 2023. DLR: Digital Realty Trust. EQIX: Equinix.
Historical performance is not an indication of future performance and any investments may go down in value.
Looking at Figure 2c:
- Logistics/industrial REITs are trading at a premium P/AFFO ratio when viewed relative to all US REITs. Still, this figure has gone from a high of near 35.0x to something closer to 20.0x. The average over the prior 10 years is close to 25.0x.
- Those logistics/industrial REITs involved with utilising technology to deliver goods to consumers faster are still in high demand and seeing a lot of activity. We believe that the premium multiple relative to the market does make sense, and the correction in valuation from 35.0x to roughly 20.0x does reflect the shift in economic growth expectations.
Figure 2c: Industrials involved with logistics
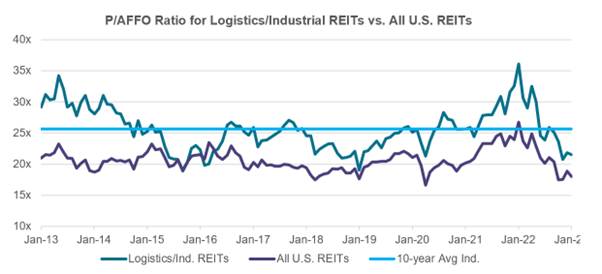
Sources: Bank of America, compiled by CenterSquare in January 2023.
Historical performance is not an indication of future performance and any investments may go down in value.
Bottom line: possibility of strong growth at a more reasonable price
As of 31 December 2022, the CenterSquare New Economy Real Estate Index demonstrated weighted average EBITDA growth of 15.08%2. Broad real estate benchmarks, as of that same period, were in the roughly 7-8% range on this metric3. This tells us that a focus on technology within real estate has been demonstrating growth. If this premium growth relative to the broader market can be maintained—and we believe that it can, especially relative to older office buildings and strip malls—2022’s correction could represent an interesting catalyst to more closely review the sector.
Sources
1 Source: CenterSquare
2 Source: CenterSquare
3 Source: CenterSquare
—
Originally Posted February 15, 2023 – Look to new economy real estate in 2023
Disclosure: WisdomTree U.S.
Investors should carefully consider the investment objectives, risks, charges and expenses of the Funds before investing. U.S. investors only: To obtain a prospectus containing this and other important information, please call 866.909.WISE (9473) or click here to view or download a prospectus online. Read the prospectus carefully before you invest. There are risks involved with investing, including the possible loss of principal. Past performance does not guarantee future results.
You cannot invest directly in an index.
Foreign investing involves currency, political and economic risk. Funds focusing on a single country, sector and/or funds that emphasize investments in smaller companies may experience greater price volatility. Investments in emerging markets, real estate, currency, fixed income and alternative investments include additional risks. Due to the investment strategy of certain Funds, they may make higher capital gain distributions than other ETFs. Please see prospectus for discussion of risks.
WisdomTree Funds are distributed by Foreside Fund Services, LLC, in the U.S. only.
Interactive Advisors offers two portfolios powered by WisdomTree: the WisdomTree Aggressive and WisdomTree Moderately Aggressive with Alts portfolios.
Disclosure: Interactive Brokers
Information posted on IBKR Campus that is provided by third-parties does NOT constitute a recommendation that you should contract for the services of that third party. Third-party participants who contribute to IBKR Campus are independent of Interactive Brokers and Interactive Brokers does not make any representations or warranties concerning the services offered, their past or future performance, or the accuracy of the information provided by the third party. Past performance is no guarantee of future results.
This material is from WisdomTree U.S. and is being posted with its permission. The views expressed in this material are solely those of the author and/or WisdomTree U.S. and Interactive Brokers is not endorsing or recommending any investment or trading discussed in the material. This material is not and should not be construed as an offer to buy or sell any security. It should not be construed as research or investment advice or a recommendation to buy, sell or hold any security or commodity. This material does not and is not intended to take into account the particular financial conditions, investment objectives or requirements of individual customers. Before acting on this material, you should consider whether it is suitable for your particular circumstances and, as necessary, seek professional advice.
Disclosure: Alternative Investments
Alternative investments can be highly illiquid, are speculative and may not be suitable for all investors. Investing in Alternative investments is only intended for experienced and sophisticated investors who have a high risk tolerance. Investors should carefully review and consider potential risks before investing. Significant risks may include but are not limited to the loss of all or a portion of an investment due to leverage; lack of liquidity; volatility of returns; restrictions on transferring of interests in a fund; lower diversification; complex tax structures; reduced regulation and higher fees.


![[Gamma] Scalping Please](https://ibkrcampus.com/wp-content/smush-webp/2024/04/tir-featured-8-300x169.jpg.webp "[Gamma] Scalping Please")