


![[Gamma] Scalping Please](https://ibkrcampus.com/wp-content/smush-webp/2024/04/tir-featured-8-700x394.jpg.webp "[Gamma] Scalping Please")


It sometimes amazes me how quickly market mentality can shift. The latest evidence is in the recent quick drop in the Cboe Volatility Index (VIX). Just two days ago, VIX closed at 20.58. As I write this, VIX is 18.76. A two-point drop in VIX is hardly noteworthy in most cases, but when the change in sentiment results largely from major indices’ ability to hold support at major moving averages, it seems tenuous.
VIX, 3-Months, Daily Bars (red/green)
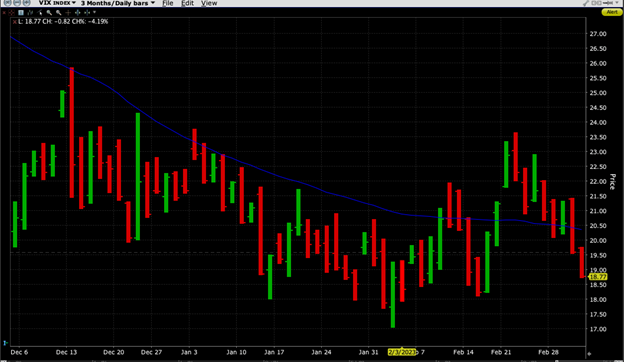
Source: Interactive Brokers
We see from the graph above that VIX has largely remained within a 18-24 trading range for this year-to-date. It’s understandable why the current trading range is below the prior 20-26 range – we have been operating under a risk-on mindset since the calendar turned. It is also notable that the recent low is an outlier. That occurred on February 2nd, the day after the last FOMC meeting, when stocks rallied sharply on enthusiasm about disinflation. The enthusiasm was curbed by the next day’s Payrolls report, of course, but two days of solid rallies based on a perceived change in Fed rhetoric was certainly a valid reason for investors to turn sanguine, if only temporarily.
Yesterday’s rally occurred after Atlanta Fed President Bostic, said, “I’m firmly in the quarter-point move camp.” Never mind that his comments did nothing to move expectations about the next FOMC meeting. The odds were about 75% for a quarter-point rise and 25% for a half-point rise before and after Bostic spoke. It was enough for traders who had been encouraged that major indices had not meaningfully broken support amidst lackluster selling. The graph below shows how the 50- and 200-day moving averages converge with a trendline that was established in October and January right around yesterdays’ lows.
S&P 500 (SPX) 6-Months Daily Bars (red/green) with 200-Day Moving Average (yellow), 50-Day Moving Average (blue) and Trendline (white)
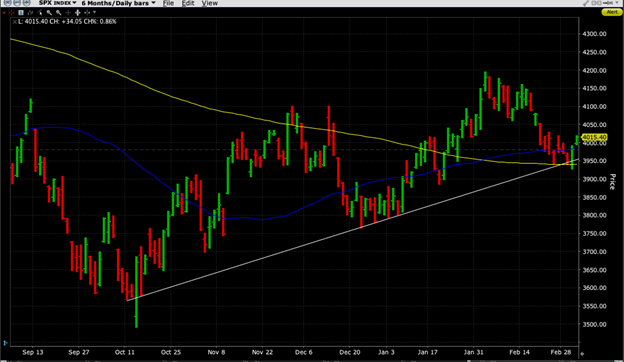
Source: Interactive Brokers
Traders know that if selling doesn’t work, you might as well try buying. Off we went yesterday, with follow-through today with no particular underlying reason for the upward move. Let’s see if we get another late afternoon ramp fed by expiring calls.
To be quite fair, it will take some work for major indices to meaningfully break down from current levels. Stocks are well supported, and it is clear that there are willing buyers on dips, particularly when those converge with key support.
But it is also important to remember what VIX measures. According to the Cboe, “The VIX Index is a calculation designed to produce a measure of constant, 30-day expected volatility of the U.S. stock market, derived from real-time, mid-quote prices of S&P 500® Index (SPX℠) call and put options.” Should we reasonably be expecting modest volatility over the next 30 days? Next week we have Chairman Powell’s semi-annual testimony before Congress and the monthly Payrolls report. The following week brings CPI and PPI, while the week after that contains the next FOMC meeting.
Sure, there’s always something coming down the pike. But any of the above events could provide the sort of catalysts that could bring a downside surprise that pierces the so-far solid technical support. The traders who are marking down the price of volatility are implicitly saying that we are looking at only minor volatility catalysts over the coming 30 days. If you have a different view about the likelihood of an eventful market, there is now a sale on volatility.
Disclosure: Interactive Brokers
The analysis in this material is provided for information only and is not and should not be construed as an offer to sell or the solicitation of an offer to buy any security. To the extent that this material discusses general market activity, industry or sector trends or other broad-based economic or political conditions, it should not be construed as research or investment advice. To the extent that it includes references to specific securities, commodities, currencies, or other instruments, those references do not constitute a recommendation by IBKR to buy, sell or hold such investments. This material does not and is not intended to take into account the particular financial conditions, investment objectives or requirements of individual customers. Before acting on this material, you should consider whether it is suitable for your particular circumstances and, as necessary, seek professional advice.
The views and opinions expressed herein are those of the author and do not necessarily reflect the views of Interactive Brokers, its affiliates, or its employees.


