


![[Gamma] Scalping Please](https://ibkrcampus.com/wp-content/smush-webp/2024/04/tir-featured-8-700x394.jpg.webp "[Gamma] Scalping Please")


Traders typically love volatility, at least within reason. Volatility means that prices are moving up and down, which brings opportunities to make money. Investors usually prefer quieter markets, at least when they are slowly rising like they were during the springtime. Yet there are times when the preferences of traders and investors are in alignment. The past two days have been among them.
Consider the gyrations of the S&P 500 Index (SPX) the past five days:
SPX 5 Day Chart, June 15th – 21st
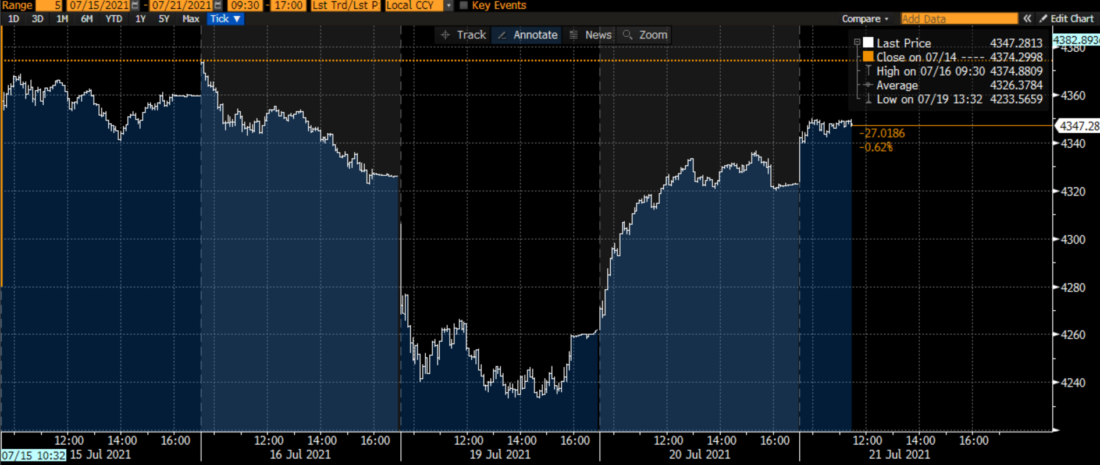
Source: Bloomberg
If an investor had taken the past few days off to go fishing, he might not have noticed much different in his portfolio. Yes, some stocks would have moved higher or lower, but a balanced portfolio in large cap stocks would be essentially unchanged. No harm done, right?
Yet the difference in sentiment between Monday and Tuesday of this week was striking. On Monday, my phone would not stop ringing, as friends and journalists sought comment on the eye-popping decline. Even my favorite local weatherman tweeted about the market. (We’re both in the business of making dubious forecasts.) Yesterday, when the move was nearly identical in magnitude to that of the prior day, I participated in fewer discussions. The underlying message is – markets are supposed to go up, even when the upward move is an outlier. The 1.5% downdraft was scary; the subsequent 1.5% updraft was business as usual.
We see something similar in the VIX futures curves over this time period:
CBOE Volatility Index (VIX) Futures Curves, Past 5 Sessions

Source: Bloomberg
It is helpful if we follow the curves in time sequence: magenta, then red, blue, orange, green. Like the S&P 500 Index that underlies it, VIX has largely returned to the levels seen last week. The front end of the futures curve is almost identical to that portion of Friday’s curve, though the outer months are slightly higher. We also see that with the exception of Monday, the moves in the curve have all been roughly parallel. The shapes of the curves are almost identical as they move up and down. Monday’s curve, while registering the highest values, still saw most of its movement in the front end. Even so, the curve never inverted, which is a sign that there is a true scarcity of volatility protection. I recall a slight inversion in the front month at the worst of the decline, but that had been cured by the end of the trading day.
A longer term view of VIX shows how little panic registered in that market:
VIX Index, 1 Year Candles

Source: Bloomberg
Despite the eye-popping nature of Monday’s decline, VIX barely stuck its head over its longer term average on 22.6053 before quickly reverting towards the lower end of its trading range. We discussed this possibility on Monday, writing: “Today’s move could yet prove to be another fleeting hiccup in the markets’ steady advance and an opportunity to sell volatility at higher levels.”. So far, that is proving to be the correct assessment, though it is too early to assert that the steady advance is continuing. That said, we are seeing periodic spikes in VIX returning with some regularity, though VIX is tending to peak at low levels compared to recent history.
The issue for both traders and investors is whether to embrace volatility or not. We have seen volatility measures sinking throughout the past few months, even as the picture for the paths of monetary and fiscal stimuli has clouded. The path forward is usually studded with potholes. We hit one of them on Monday, yet it failed to dent the market’s progress. We had a smooth ride for much of the past year, but we have to be careful to remember that rough rides don’t always pass as quickly as this most recent one.
Disclosure: Interactive Brokers
The analysis in this material is provided for information only and is not and should not be construed as an offer to sell or the solicitation of an offer to buy any security. To the extent that this material discusses general market activity, industry or sector trends or other broad-based economic or political conditions, it should not be construed as research or investment advice. To the extent that it includes references to specific securities, commodities, currencies, or other instruments, those references do not constitute a recommendation by IBKR to buy, sell or hold such investments. This material does not and is not intended to take into account the particular financial conditions, investment objectives or requirements of individual customers. Before acting on this material, you should consider whether it is suitable for your particular circumstances and, as necessary, seek professional advice.
The views and opinions expressed herein are those of the author and do not necessarily reflect the views of Interactive Brokers, its affiliates, or its employees.
Disclosure: Futures Trading
Futures are not suitable for all investors. The amount you may lose may be greater than your initial investment. Before trading futures, please read the CFTC Risk Disclosure. A copy and additional information are available at ibkr.com.


