


![[Gamma] Scalping Please](https://ibkrcampus.com/wp-content/smush-webp/2024/04/tir-featured-8-700x394.jpg.webp "[Gamma] Scalping Please")


The Cboe Volatility Index (VIX) had a mildly stunning close last week. It finished last week at 17.07. Except for a fleeting 17.06 print on February 2nd (when it closed at 18.64), this was the lowest level we have seen in over a year. The last time we closed below Friday’s level was on January 4th, 2022. I’ve heard several commentators discuss how the current low readings of VIX indicate how the bull market is back. I wish I could agree.
If the dates noted above ring a bell, they should. Both represented market peaks – one local and one secular. Over the course of my career, I have found extreme levels of VIX to be a contrarian, rather than a confirming indicator.
February 2nd was the day after the FOMC meeting when Federal Reserve Chair Powell unleashed the term “disinflation” to wild market acclaim. Stocks rose sharply that day, with the S&P 500 (SPX) rising by 1.47% and the NASDAQ 100 (NDX) leaping by 3.56% after posting a 2.16% gain the day prior. Sentiment was wildly enthusiastic that day, with options volume setting a new record, propelled by the discovery that there were index and ETF options that expired that afternoon instead of the end of the week. As options trading became rampant, hedgers who remembered that a Nonfarm Payrolls report was due the next day sought protection in longer-dated options, some of which pushed VIX higher. The following day’s report was disappointing, stocks fell, and February 2nd remains the high for 2023 thus far.
SPX 3-Month Chart, Daily Bars
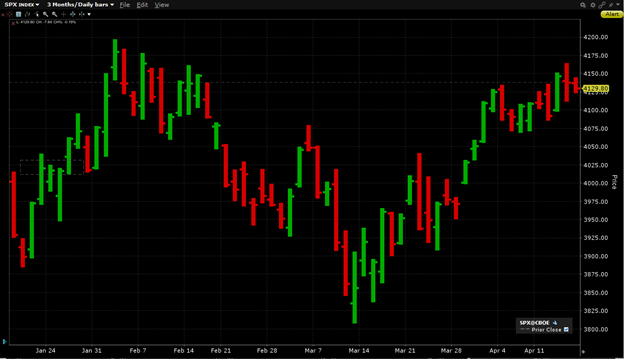
Source: Interactive Brokers
January 4th 2022 marked the high for the post-pandemic bull market. We had been churning around all-time highs for several weeks – and in fact NDX topped out in late November – and the second trading day of last year proved to be a lasting high. Those who took the low readings in VIX as a sign of bullish things to come were sadly mistaken.
SPX 18-Month Chart, Daily Bars
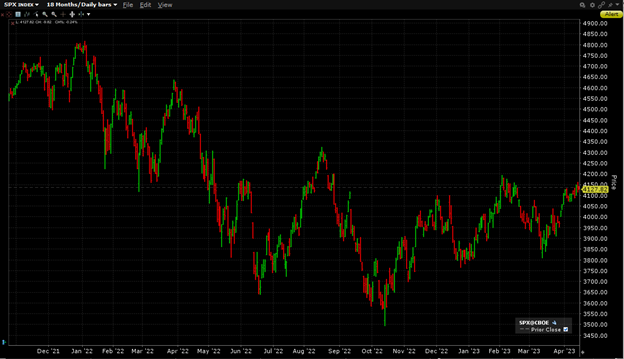
Source: Interactive Brokers
As noted above, I tend to look to extremes in VIX – both high and low – as a contrarian sign. When traders become too fearful, they clamor for volatility protection. That pushes VIX to higher levels, sometimes extraordinarily so. The nervousness can persist for some time, but once VIX puts in a clear top, it usually means that the worst of the crisis has passed. Market bounces often follow. The following graph makes that evident. It shows the level of VIX plotted against the subsequent one-month change in SPX. It is not a perfect correlation, but VIX’s contrarian nature should be quite clear.
VIX (blue line, left scale) vs. Subsequent 1-Month % Change in SPX (purple bars, right scale)
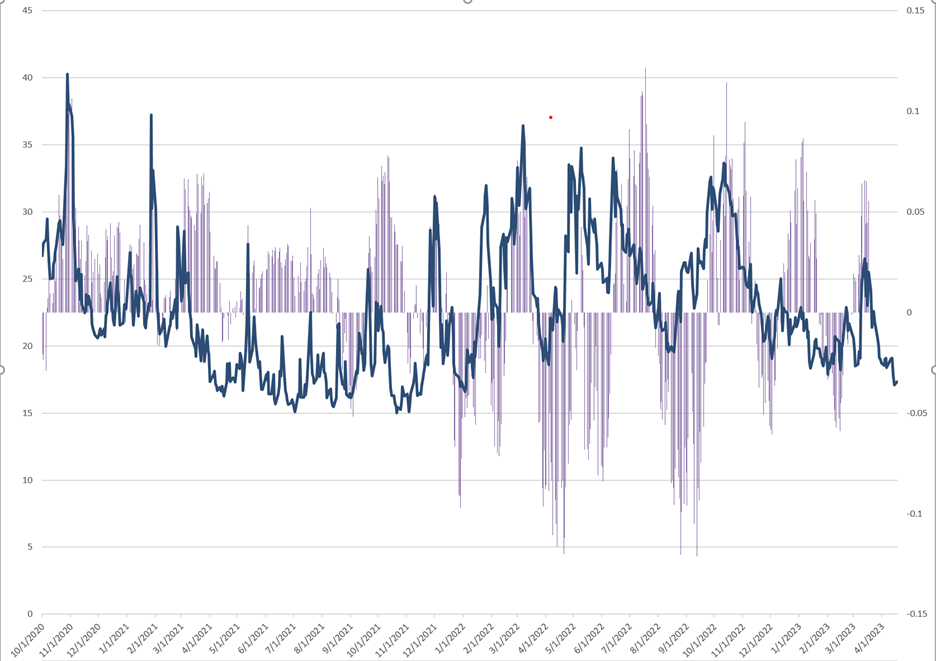
Source: Interactive Brokers
It can be a bit trickier when VIX is heading lower amidst a broad market rally. It is always clear in hindsight when complacency reaches an extreme, but it can be quite difficult to discern the sort of well-earned confidence that accompanies broad market rallies from the complacency that signifies a market peak. There is a saying that no one rings a bell at the top, so the decision process is necessarily more nuanced and qualitative. One way to do that is to consider the events that are likely to occur over the upcoming 30-day period that VIX is meant to measure and decide whether those “known unknowns” seem to be priced properly.
I am concerned that VIX is underpricing the series of events that we know to expect over the coming weeks. We have just begun earnings season; two weeks ago we highlighted the risks that the narrowing leadership of megacap tech pose to the now top-heavy indices that they dominate. Tesla (TSLA) will be the first megacap when reports on Wednesday, with the others to follow next week. We also have only just begun to hear from the regional banks that were so concerning last month. There is an FOMC meeting on May 3rd. While there is now an 88% implied likelihood of a 25 basis point hike, the likely path of any potential future hikes and assumed cuts should be more clarified at the meeting and in its aftermath. And oh, has anyone ever heard the expression “sell in May and go away?”
It would be terrific if earnings season progresses as planned, that the FOMC meeting goes smoothly, and that the usual seasonality is not problematic. But VIX seems to be implying that there is little cause for concern, and that’s not a bet I’m willing to make.
Disclosure: Interactive Brokers
The analysis in this material is provided for information only and is not and should not be construed as an offer to sell or the solicitation of an offer to buy any security. To the extent that this material discusses general market activity, industry or sector trends or other broad-based economic or political conditions, it should not be construed as research or investment advice. To the extent that it includes references to specific securities, commodities, currencies, or other instruments, those references do not constitute a recommendation by IBKR to buy, sell or hold such investments. This material does not and is not intended to take into account the particular financial conditions, investment objectives or requirements of individual customers. Before acting on this material, you should consider whether it is suitable for your particular circumstances and, as necessary, seek professional advice.
The views and opinions expressed herein are those of the author and do not necessarily reflect the views of Interactive Brokers, its affiliates, or its employees.
Disclosure: Options Trading
Options involve risk and are not suitable for all investors. Multiple leg strategies, including spreads, will incur multiple commission charges. For more information read the "Characteristics and Risks of Standardized Options" also known as the options disclosure document (ODD) or visit ibkr.com/occ


![[Gamma] Scalping Please](https://ibkrcampus.com/wp-content/smush-webp/2024/04/tir-featured-8-300x169.jpg.webp "[Gamma] Scalping Please")
Join The Conversation
If you have a general question, it may already be covered in our FAQs. If you have an account-specific question or concern, please reach out to Client Services.