


Think for a moment about what has transpired in the six weeks since the last FOMC meeting. On February 1st, we were reveling in Fed Chair Powell’s use of the word “disinflation”. The fun continued the next day, with a major rally abetted by traders who discovered that so-called “0DTE” options allowed them to speculate on that day’s move without needing to carry their options into the next day’s Payrolls report. That was a smart move because the March 3rd reports caused equities to give back most of the prior day’s advance.
That was just the beginning. The coming weeks would bring a series of disappointing inflation reports that persisted throughout the month. Rates climbed steadily throughout February, with 2-year Treasury yields climbing from just over 4% to over 5% by early March and 10-years going from 3.35% to over 4%. For a day or so, we had the entire yield curve yielding above 4%. Shortly afterwards, the banking dominoes began to fall: Silvergate (SI), Silicon Valley Bank (SIVB), Signature Bank (SBNY) and Credit Suisse (CS). Rates dropped precipitously on the flight to safety, with 2-year and 10-year rates plunging over the course of a few days to revert to roughly the levels we saw around the prior FOMC meeting. Fed Funds futures echoed that volatility, with peak rate expectations going from about 4.9% to about 5.7% and back.
Despite all that volatility in the financial system, the S&P 500 Index (SPX) is only down about 1.5% since the day prior to the February meeting, and the NASDAQ 100 (NDX) is up about 6.5%. There were some big swings over the past six weeks, but for the most part, the volatility in relatively risk-free assets did not immediately translate to broad-based concerns in stocks. This is even though stocks are the highest duration assets. Or more likely, that’s a feature, not a bug – at least for now.
Among the assumptions that made a huge round trip was market expectations for today’s FOMC meeting. Fed Funds futures are currently pricing in an 80% chance of a 25-basis point hike today. That’s where we stood just after the last meeting. Of course, we went from over a 60% chance of a 50bp hike to less than a 50% chance of 25bp in between, not to mention pricing in a maximum of over 3 cuts by this time next year (we’re now looking at a net of 1 cut).
Considering all that has transpired since the last meeting, we might expect options markets to be expecting unusual volatility or some outright fear over the coming days. Not really.
Thus far this week, we have seen the Cboe Volatility Index (VIX) plunge from about 28 to just over 20. The banking crisis seems to be largely in the market’s rear-view mirror. We’re not back to the 18 handle that we saw two-three weeks ago – when we declared that the market had a sale on volatility – but a sanguine response to the FOMC outcome could put us right back there. (Remember that VIX uses SPX options with 23-37 days to expiry in its calculations, so expectations for today’s move play only a very minor role.)
The sanguine attitude toward equities is reflected in the options market’s expectations for the likely outcomes over the coming days and weeks. Using the IBKR Probability Lab, we see that there are consistent peaks in above-market options; slight for today, substantial for April’s monthly expiry.
IBKR Probability Lab for SPY Options Expiring March 22nd
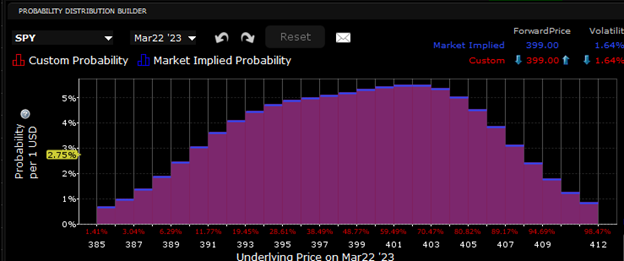
Source: Interactive Brokers
IBKR Probability Lab for SPY Options Expiring March 24th
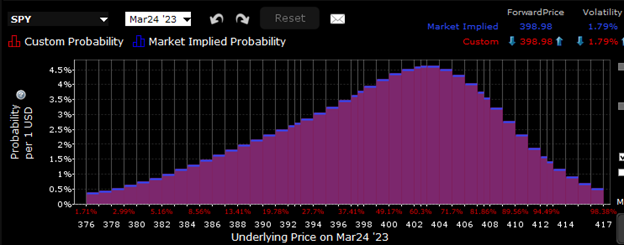
Source: Interactive Brokers
IBKR Probability Lab for SPY Options Expiring April 21st
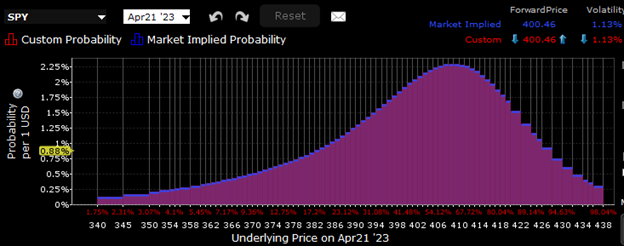
Source: Interactive Brokers
Notice how the peak is not only typically above the implied forward price, but also that the peak moves steadily upward. We see a relatively flattish range for values about +/-1% around the current value for options expiring today, a peak expectation of +1% for the end of this week, and a peak over 2.5% for mid-April.
We also see relatively flattish skew for those same options. Those expiring today are now pricing in an extraordinarily high amount of implied volatility – over 4.5% — but we see the volatility dissipating quickly even by the end of the week. In all cases, we see little excess demand for protective puts:
Multi-Expiry Skew for SPY Options Expiring March 22nd, March 24th and April 21st
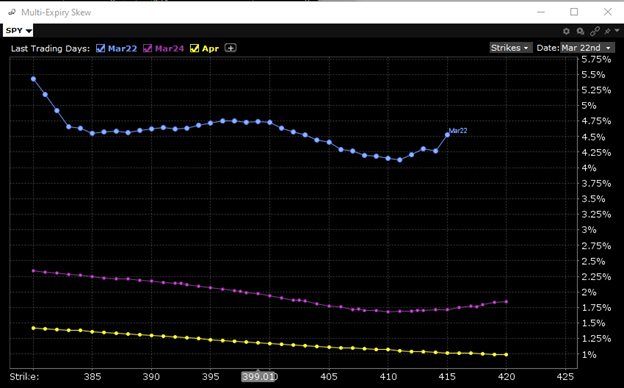
Source: Interactive Brokers
Like many investors, I’ve been wrestling with the possible outcomes for today’s FOMC meeting. My base case is for a 25bp hike. The FOMC doesn’t typically surprise markets, and no hike would now be considered a surprise. If they stand pat, there would be broad concerns along the lines of “What’s wrong? What do they see that we don’t?” In light of all the persistent commentary from Fed talking heads about no rate cuts before the end of the year, it seems reasonable to think that the “dot plot” would reflect the same. It would be at odds with the new expectations of a cut. I also expect the Chair to take a conciliatory tone, playing down concerns about a metastasizing bank crisis. In theory, that should mollify investors, but it could disappoint those who are hoping for another dose of Fed liquidity. Remember, a generation of investors has come to see liquidity as the single most important reason to buy stocks, even amidst rising economic risks.
Finally, for some added perspective, here is an updated version of a table you may have seen before. It shows the one and three day moves that have occurred after each of the FOMC meetings since the Covid crisis. We typically see the initial move set the tone for the rest of the week, though the high-low range over that period is typically over 4%. Importantly, four of the last eight meetings have seen one-day moves of over 2.24% and three-day ranges over 5%. And not all those meetings were as “in-play” as today’s.
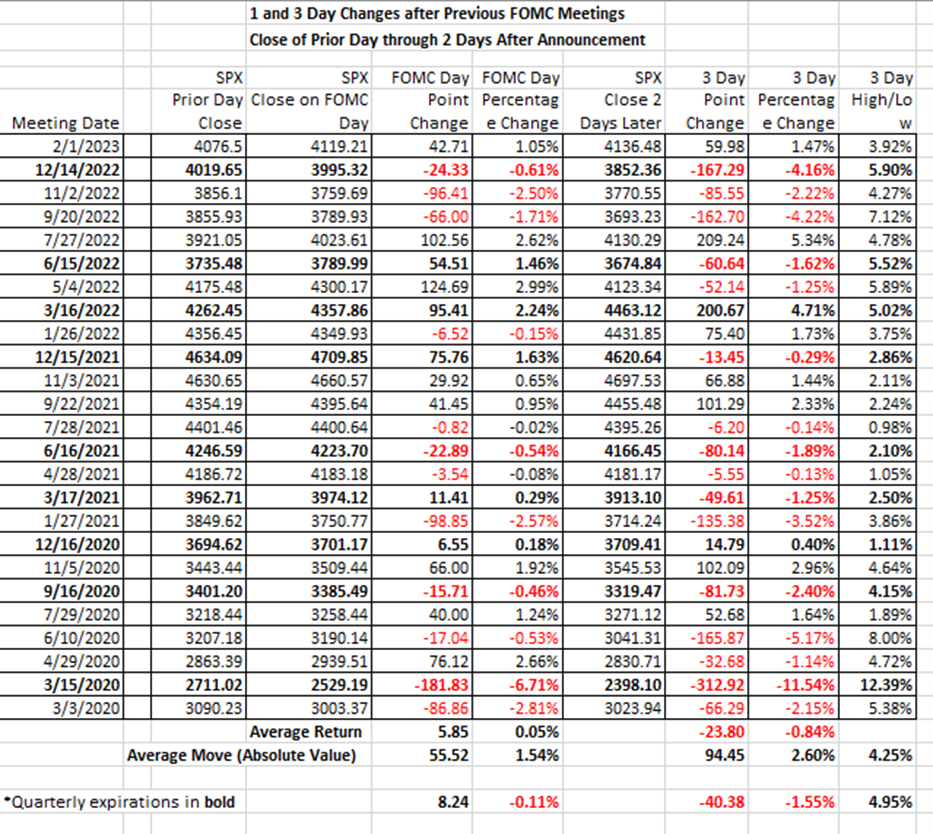
Source: Interactive Brokers
Disclosure: Interactive Brokers
The analysis in this material is provided for information only and is not and should not be construed as an offer to sell or the solicitation of an offer to buy any security. To the extent that this material discusses general market activity, industry or sector trends or other broad-based economic or political conditions, it should not be construed as research or investment advice. To the extent that it includes references to specific securities, commodities, currencies, or other instruments, those references do not constitute a recommendation by IBKR to buy, sell or hold such investments. This material does not and is not intended to take into account the particular financial conditions, investment objectives or requirements of individual customers. Before acting on this material, you should consider whether it is suitable for your particular circumstances and, as necessary, seek professional advice.
The views and opinions expressed herein are those of the author and do not necessarily reflect the views of Interactive Brokers, its affiliates, or its employees.
Disclosure: Options Trading
Options involve risk and are not suitable for all investors. Multiple leg strategies, including spreads, will incur multiple commission charges. For more information read the "Characteristics and Risks of Standardized Options" also known as the options disclosure document (ODD) or visit ibkr.com/occ

