


I’ve always been much busier in down markets than up. When I was a position trader and options market-maker, this was obvious. When markets are calm, there is less need for institutions to utilize broker/dealer capital to put on positions and there is typically less demand for options protection. I learned how to recognize warning signs early in my career, and quite frankly some of my best years occurred during bear markets.
Now that I have switched primarily to punditry, I find that I continue to be in more demand in down markets than in up. I am hardly the sort of perma-bull who attracts notice in bull markets, but I’d like to think that I do a solid job of explaining market weirdness. And when we’ve been in a bull market for the better part of a decade-plus, a bear market can be categorized as weirdness.
A question that I’ve been asked with increasing frequency is: “Why is the Cboe Volatility Index (VIX) so low?” Or alternatively, “Why isn’t VIX higher?”
I understand the rationale behind the question. We have been told for years that VIX is the market’s fear gauge. A snarky response would be, “it’s not a fear gauge, but it plays one on TV.” My more reasoned explanation, which I laid out in December, 2020, is that “VIX is Not Now, Nor Has It Ever Been, the Fear Index.”
It is quite understandable why that perception has arisen. VIX tends to move inversely to the broader market. It tends to rise when markets fall, and vice versa. That would indeed be reflective of the level of fear in the marketplace. But the comparison is flawed. There is no specific level of VIX that indicates fear or complacency. As a result, when we see the S&P 500 Index (SPX) falling by a double-digit percentage in a short period of time and flirting with lows for the year, yet VIX is trading well below where it was the last time we were at this point on SPX, people question what’s wrong with VIX.
To illustrate, on the graph below, compare the peaks in VIX seen earlier this year with its current level. The mood does not feel appreciably better than it did in June, yet the current VIX reading of 29 is well below the earlier peaks in the mid-high 30’s.
7-Months, SPX (red/green) and VIX (blue)
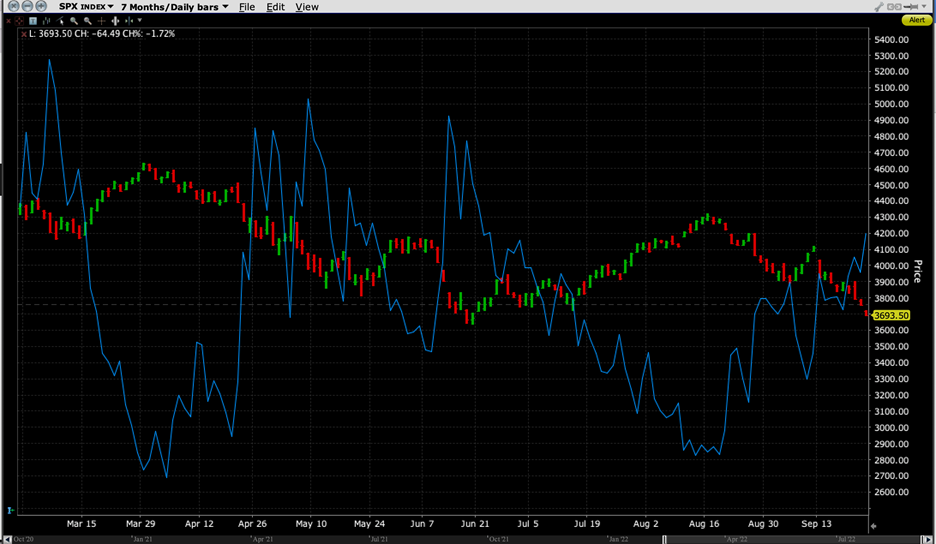
Source: Interactive Brokers
At this point it is important to understand how VIX is constructed. The FAQ page on cboe.com says nothing about fear:
What does the VIX Index measure?
The VIX Index measures the level of expected volatility of the S&P 500 Index over the next 30 days that is implied in the bid/ask quotations of SPX options. Thus, the VIX Index is a forward looking measure, in contrast to realized (or actual) volatility, which measures the variability of historical (or known) prices.
While it is quite reasonable for expected volatility to rise when markets fall, the underlying factor is the demand for SPX index options. It is important to remember that index options have key fundamental differences with equity and ETF options, something we recently explained. SPX options are traded much more extensively by institutions than by individuals. If institutions are not demanding protection, then the implied volatilities for SPX options don’t rise. Thus, nor would VIX.
One would hope that institutions have de-risked substantially since earlier this year. There is ample anecdotal evidence behind that assertion, though I can’t prove it with certainty. What I can prove is that institutions are not paying as much for protection in implied volatility terms as they were earlier this year. That translates into more subdued readings from VIX.
Another way to view the more subdued VIX is via its futures chain:
VIX Futures Chains, Today (yellow, middle), 1-Week Ago (red, bottom), June 17th, 2022 (green, top)
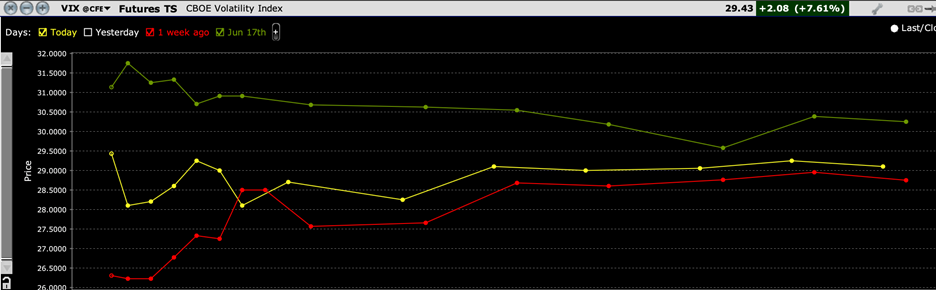
Source: Interactive Brokers
While it is quite clear that markets are pricing in significantly higher volatility than they were just a week ago (in hindsight, woefully underestimating the reaction to the FOMC meeting), they are anticipating lower volatility at all points than they were at the June lows. Importantly, that curve was more solidly inverted, which indicated a shortage of available volatility protection. Now we have some humps, particularly around the midterm elections, but the short-term supply/demand balance seems better even as expectations for future volatility remain high.
By long-term historical standards, VIX is rather high. Compared to recent history it may seem not high enough. Maybe, but the lack of panic reflected in VIX may indeed be sensible.
Disclosure: Interactive Brokers
The analysis in this material is provided for information only and is not and should not be construed as an offer to sell or the solicitation of an offer to buy any security. To the extent that this material discusses general market activity, industry or sector trends or other broad-based economic or political conditions, it should not be construed as research or investment advice. To the extent that it includes references to specific securities, commodities, currencies, or other instruments, those references do not constitute a recommendation by IBKR to buy, sell or hold such investments. This material does not and is not intended to take into account the particular financial conditions, investment objectives or requirements of individual customers. Before acting on this material, you should consider whether it is suitable for your particular circumstances and, as necessary, seek professional advice.
The views and opinions expressed herein are those of the author and do not necessarily reflect the views of Interactive Brokers, its affiliates, or its employees.
Disclosure: Options Trading
Options involve risk and are not suitable for all investors. Multiple leg strategies, including spreads, will incur multiple commission charges. For more information read the "Characteristics and Risks of Standardized Options" also known as the options disclosure document (ODD) or visit ibkr.com/occ

