


Traders love adages. “Don’t Fight the Fed”, “The Trend is Your Friend”, and “Buy the Dip” became highly worthwhile mantras for traders and investors alike. Foolproof strategies are investors’ Holy Grail, and since March 2020 following those phrases had become an essentially foolproof set of strategies.
Almost everyone who has been involved in markets over the past two years is intimately familiar with the concept of “buy the dip”. It didn’t work for every stock every time, but persistent monetary accommodation and successive bouts of fiscal stimulus provided a continual boost to asset prices. Major equity indices entered significant uptrends that rarely wavered. If one didn’t fight the Fed and embraced those trends, it became quite profitable to buy dips when they occurred in leading stocks and ETFs linked to key indices.
Yet those of us with some *ahem* history in the markets know that there is a second half to the “buy the dip” mantra. The full phrase is actually “Buy the Dips, Sell the Rips”. It’s a cute way to say “buy low, sell high”, a concept that has applied to investors since time immemorial. It’s easy to forget the second half of that phrase when markets are rising with nary a break, but forgetting that latter part can prove catastrophic.
Because the three adages referenced in the first paragraph tend to be intertwined, let’s address them sequentially. Over the past two years, the Federal Reserve expanded its balance sheet at a record pace while keeping the Fed Funds rate anchored near zero. The most recent stimuli came after over a decade of generally accommodative policies by central banks around the world. Since the global financial crisis of 2007-2009, the Fed has presided over only brief periods when it attempted to raise rates and withdraw liquidity. It is no coincidence that markets had tremors during those periods, something we noted in our 2022 outlook:
In response to the global financial crisis, the Fed and other central banks began quantitative easing in addition to low interest rates as a means to resuscitate the financial system. Over the past 12 years we have seen markets hit significant air pockets each time the Fed has even thought about reducing stimulus. Think about the taper tantrum of 2013, the market swoon in the fourth quarter of 2018 and the repo crisis of late 2019. All were events that induced volatility.
To be fair, each of those hiccups was met by another bout of Fed liquidity. But it behooved investors to be cognizant of and more risk-averse during the few times that the Fed was no longer accommodative. “Don’t Fight the Fed” meant that one should have avoided buying stocks until the Fed returned to its stimulative ways.
As a result of all that monetary accommodation, trends have largely been friendly to investors and many key trends remain that way. During uptrends, it typically behooves investors to buy dips when indices test major moving averages that have provided support to prior downdrafts, especially when those averages show rising trends. But it is important to remember that the converse holds true. When trends are pointing lower, those same moving averages tend to provide resistance points. That is when it behooves traders to sell the rips. We are starting to see that occur in some key market segments. Consider the following graphs:
S&P 500 Index (SPX) 2 Year Daily Candles (white/blue) with 10, 30, 50, 100 and 200 Day Moving Averages
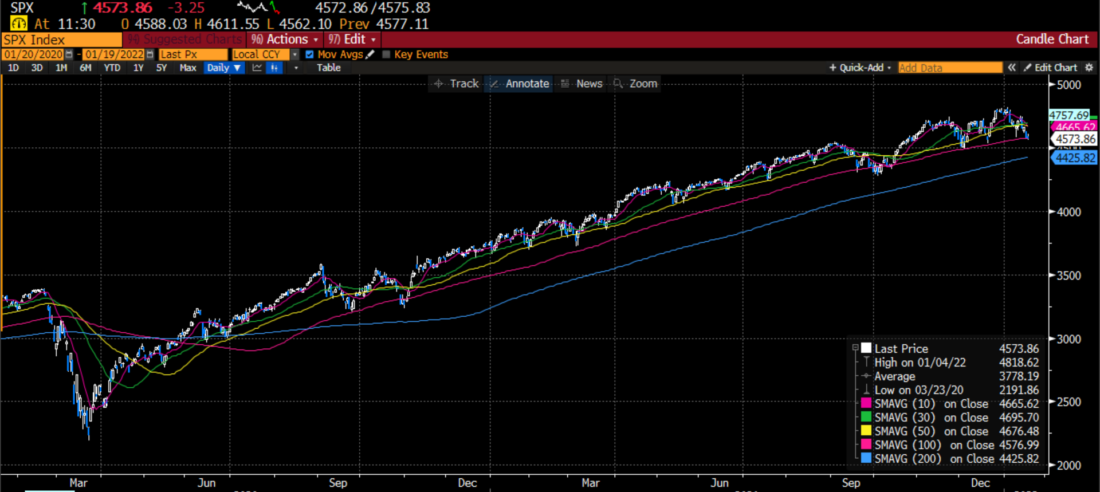
Source: Bloomberg
Despite the recent dips in SPX, the longer-term trends remain firmly in place. Both the 100 and 200-day averages are pointing higher, and the 50-day average appears to be plateauing, not yet turning lower. With this index perched upon the 100-day average – a moving average that has provided solid support during prior dips, it would not be surprising if traders view this as a buying opportunity.
NASDAQ 100 Index (NDX) 2 Year Daily Candles (white/blue) with 10, 30, 50, 100 and 200 Day Moving Averages
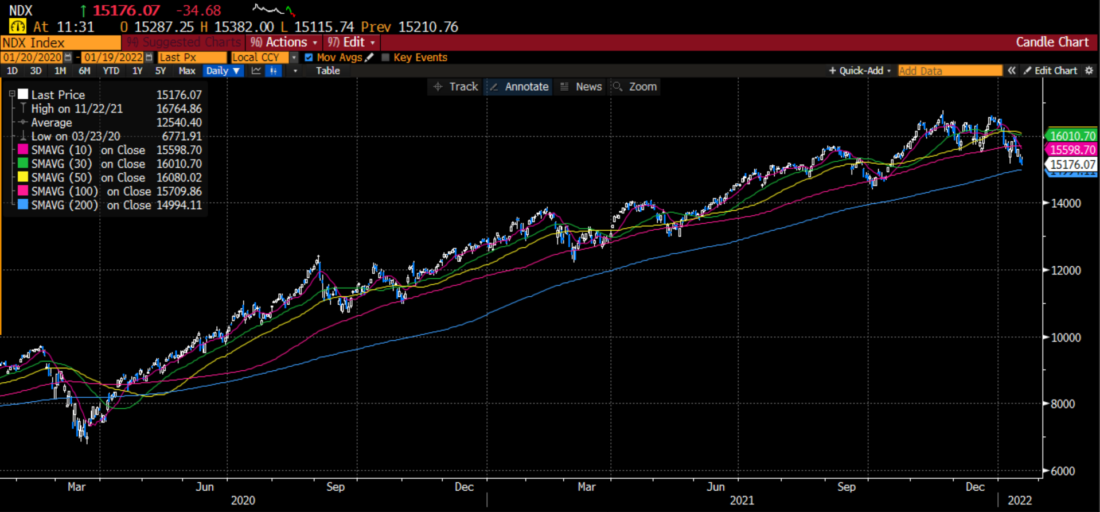
Source: Bloomberg
As with SPX, the 100 and 200-day moving averages for NDX remain in steady uptrends, though the 50-day has indeed begun to roll over. More importantly, we have seen the 100-day average fail to support this index and instead may have provided resistance during a recent attempted bounce. It has become more critical that the 200-day average provide support to this tech-heavy index, bearing in mind that NDX hasn’t come close to that moving average since the spring of 2020.
Russell 2000 Index (RTY) 2 Year Daily Candles (white/blue) with 10, 30, 50, 100 and 200 Day Moving Averages
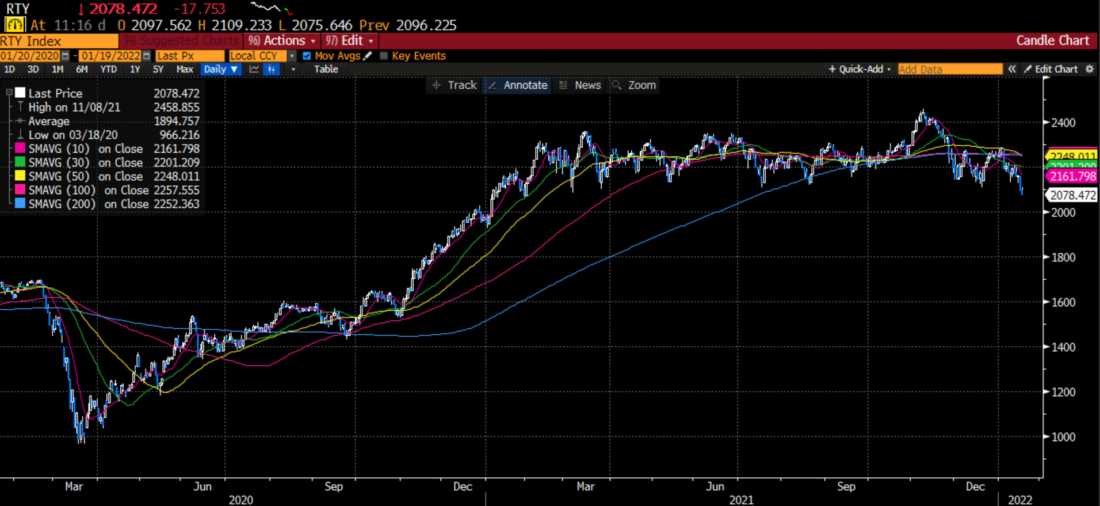
This is not a pretty chart, and could be worrisome for investors. The trends are clearly not investors’ friends for the smaller-cap Russell 2000. We saw RTY basically move sideways in a modest trading range during 2021, which is quite different than the steady rallies we saw in its large-cap brethren. This stagnation has caused flattish long-term moving averages that generally converge around the 2250 level. In a worrisome development, the index has broken down about 8% below that level and there are few obvious support levels for another 10% or so.
S&P TSX 60 Index (SPTSX, TSE60) 2 Year Daily Candles (white/blue) with 10, 30, 50, 100 and 200 Day Moving Averages
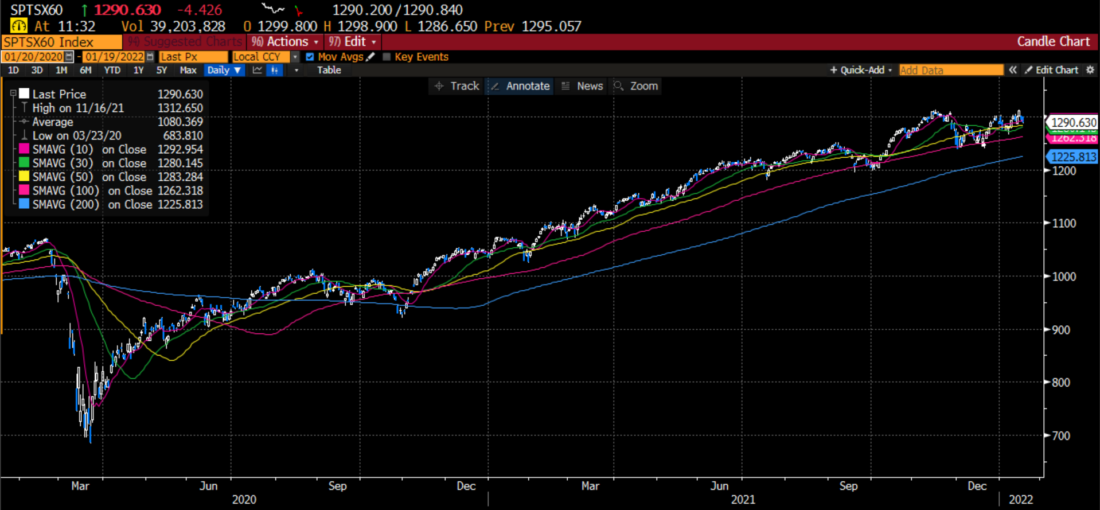
Source: Bloomberg
Here is an index where the trends are all pointing higher. While those of us in the US were off for MLK Day, our neighbors to the north were pushing this key index to a fresh all-time high. Even though banks are the largest sector in the TSE60, Canada is clearly a beneficiary of global inflation in oil and other commodity prices. Although the Bank of Canada is also moving toward a less accommodative stance, the trends in key Canadian industries, and hence their stocks and indices, remain in solid long-term uptrends.
The takeaway from these graphs is that in many cases the trend still remains investors’ friends. In those situations, “Buy the Dip” may still be a valid strategy, though the impending change in Fed policy adds a level of risk that was not present for well over a year. Yet there are already some situations where the trends have indeed turned unfriendly. Think not only of the Russell 2000 but also a wide range of former speculative darlings. “Sell the Rips” may already be a valid trading strategy for them.
I don’t think it’s time yet for all of us to dust off two more old chestnuts: “Don’t Catch a Falling Knife” and “Dead Cats Don’t Bounce”. But when fighting the Fed means a failure to recognize their shifting tactics and the trends become far less friendly, “Sell the Rips” takes on a far greater importance.
Disclosure: Interactive Brokers
The analysis in this material is provided for information only and is not and should not be construed as an offer to sell or the solicitation of an offer to buy any security. To the extent that this material discusses general market activity, industry or sector trends or other broad-based economic or political conditions, it should not be construed as research or investment advice. To the extent that it includes references to specific securities, commodities, currencies, or other instruments, those references do not constitute a recommendation by IBKR to buy, sell or hold such investments. This material does not and is not intended to take into account the particular financial conditions, investment objectives or requirements of individual customers. Before acting on this material, you should consider whether it is suitable for your particular circumstances and, as necessary, seek professional advice.
The views and opinions expressed herein are those of the author and do not necessarily reflect the views of Interactive Brokers, its affiliates, or its employees.
Disclosure: Futures Trading
Futures are not suitable for all investors. The amount you may lose may be greater than your initial investment. Before trading futures, please read the CFTC Risk Disclosure. A copy and additional information are available at ibkr.com.

