


")


By Indrani De, CFA, PRM, and Zhaoyi Yang, FRM, Global Investment Research
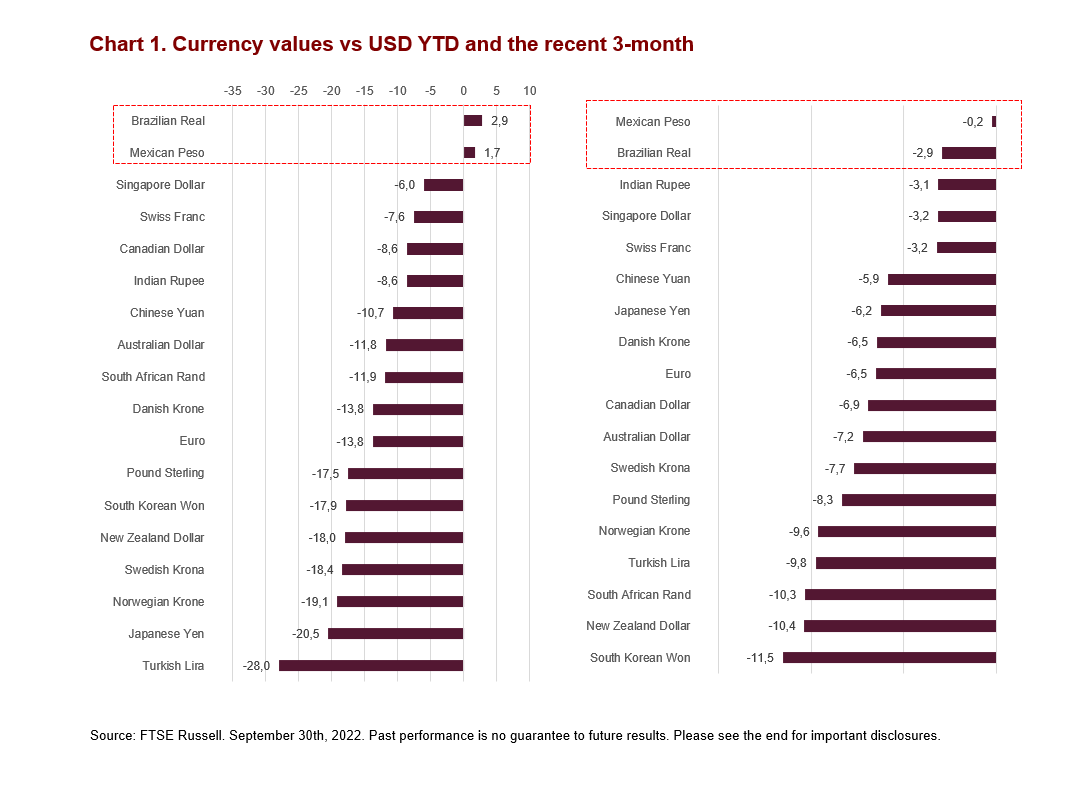
Brazilian real and Mexican peso are the only major currencies that have outperformed the strong US dollar YTD September 30, 2022. By the end of Q3 this year, Brazilian real and Mexican peso have gained 2.9% and 1.7% relative to the US dollar, respectively, both helped by the rally in Q1. Even in Q3, which saw a brutal sell-off in almost all currencies except the dollar, peso and real have managed the smallest losses of 0.2-2.9% (Chart 1). The outperformance of these two currencies may seem modest in absolute terms, but it is pronounced in the context of a strengthening US dollar, particularly so since April: The US Dollar Index (DXY), a measure of the value of the USD against a basket of US trade partners’ currencies, is up by 16.8% by the end of the third quarter, despite some criticisms that the content of the currency basket is due to be replaced to represent major US trading partners. But what factors could have been the drivers of the stronger real and peso in 2022? Perhaps the discussion could start with reasons related to the strong export performance benefiting from higher commodity prices, widening interest rate differentials due to their central banks being ahead in monetary tightening for inflation control, and the changes in capital flow following the Russia-Ukraine conflict.
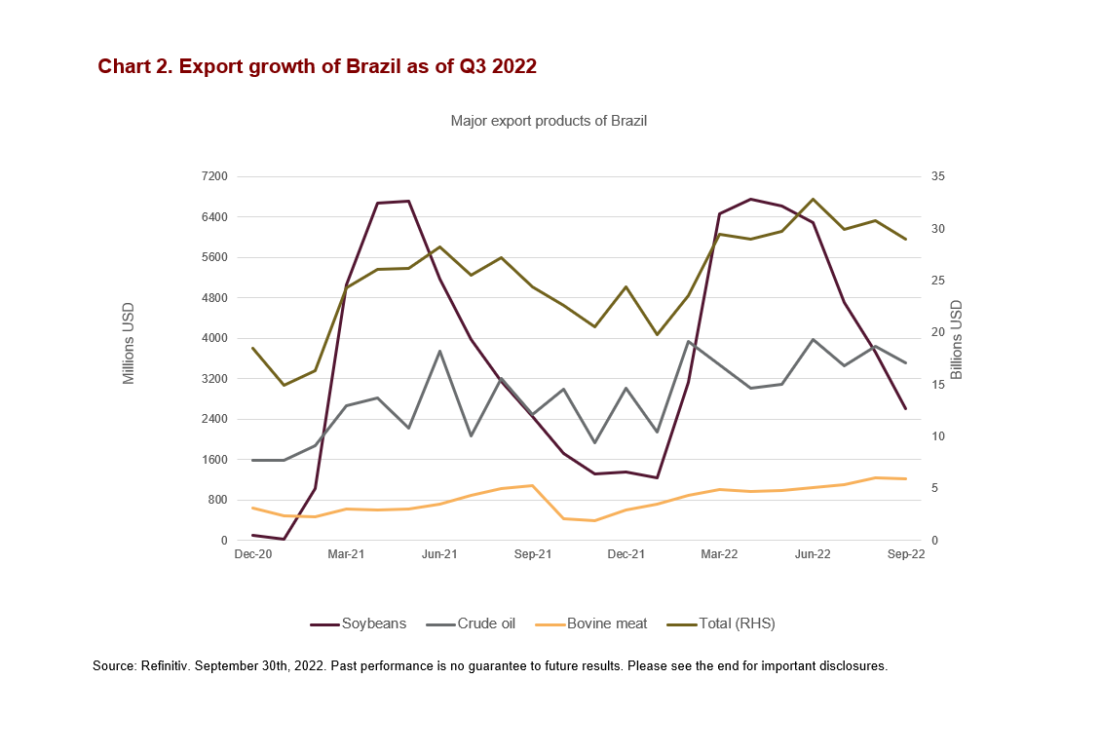
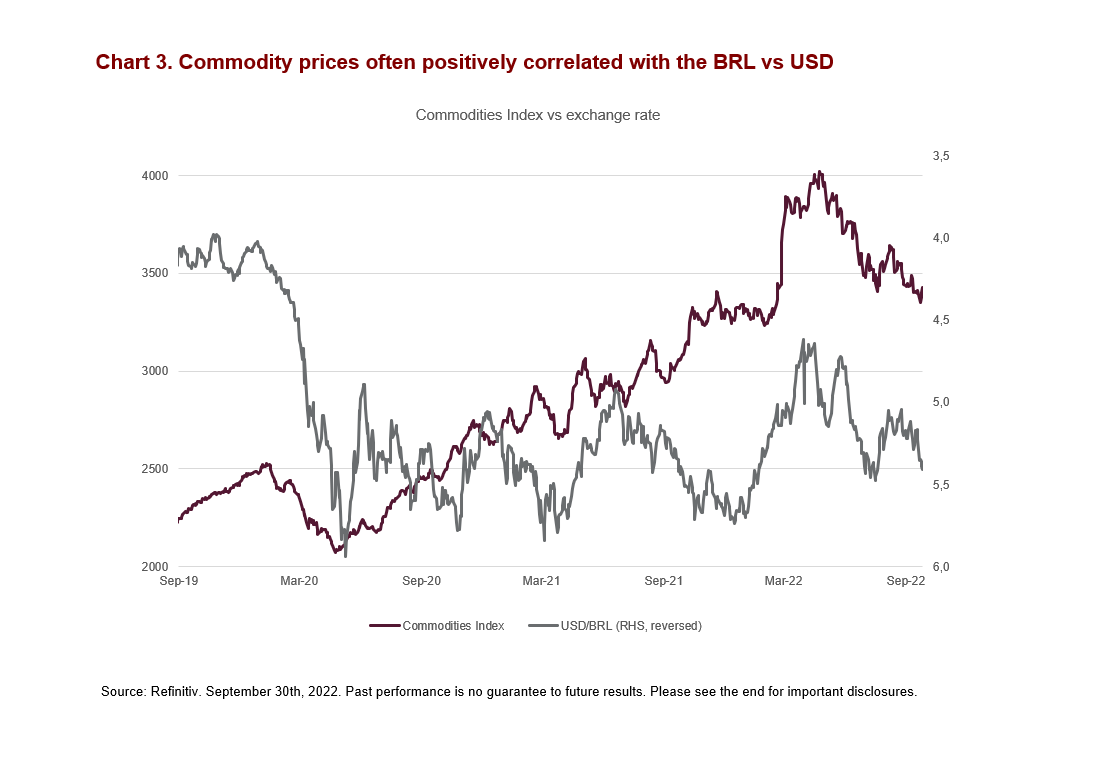
Surging commodity prices helped net commodity exporters like Brazil
Brazilian real has benefitted from its strong exports earlier this year, thanks to the strong demand and higher commodity prices, e.g., price rises in crude oil and agricultural products, amid the global supply disruptions since the Russian-Ukraine conflict started. Total exports of Brazil broadly increased in 2022, as Chart 2 shows, driven by the growth in crude oil and soybeans. Also, Chart 3 shows the positive correlation between commodity prices and Brazilian Real-USD exchange rate in recent years. Meanwhile in Mexico, higher energy prices led the government to reverse its plan to phase out crude oil exports (the plan was to reduce daily exports by more than half in 2022 and eventually end oil exports by 2023) in order to achieve self-sufficiency in the domestic fuel market instead of importing expensive refined products from US refineries. Mexico’s average export of petroleum products and crude oil was 960 thousand Barrel/Day in the first eight months of 2022 (dragged by the cut in January), only a modest reduction from the average 1.02 million in 2021 (Refinitiv). So, the combined effect of stable export in barrels, and surging oil prices, resulted in an upward swing in total values of Mexico’s oil exports and thus the currency value of peso.
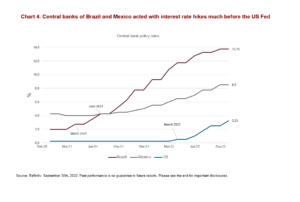
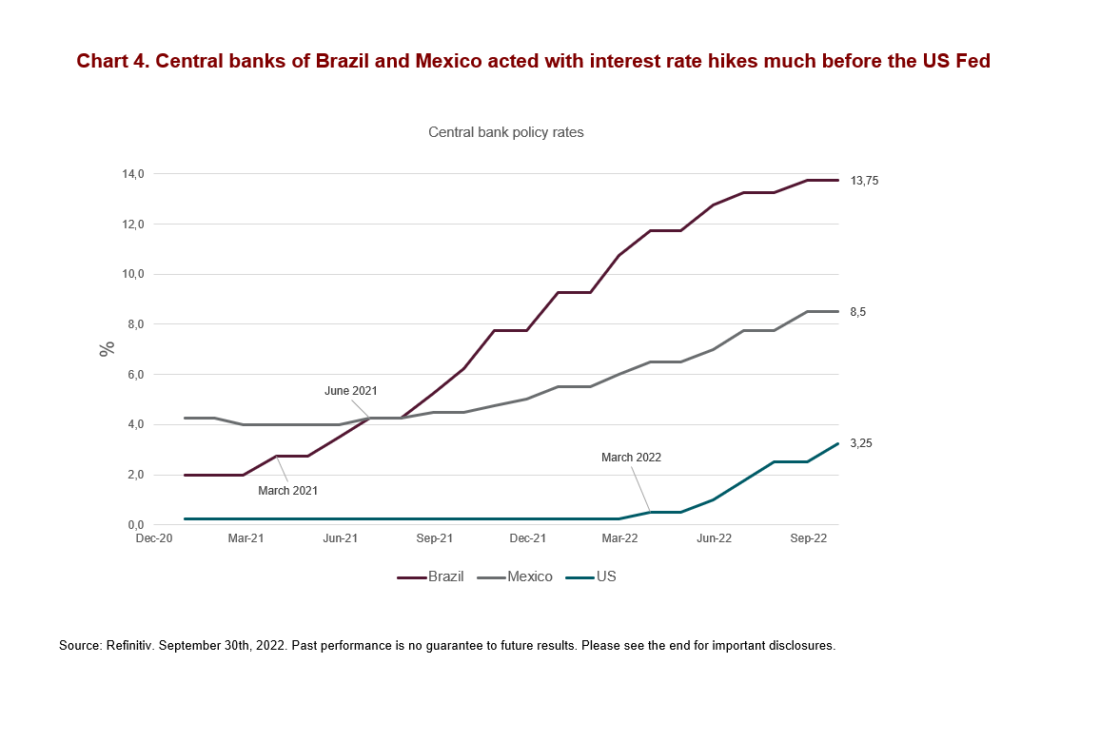
Central banks in Brazil and Mexico tightened monetary policies much earlier than the US Fed
In face of the price pressures last year, the Brazilian central bank initiated its first interest rate hike in March 2021 to fight the higher inflation – followed by The Bank of Mexico in June – a year earlier than the US Fed, which didn’t react until March 2022, as Chart 4 shows. The interest rate differentials between these two Latin American markets and the US have remained substantial since then, although the Fed caught up very quickly in 2022, providing investors with an attractive opportunity for carry trades. Carry trade would have implied that the traders borrowed money in the low-yielding US dollar and invested in the higher returning Brazilian real and Mexican peso, and this resulting higher demand for the real and peso may have helped to push these currencies higher in the first quarter.
Capital inflows into the Brazilian financial market following Russia’s exclusion from equity indices
In addition to their higher interest rates, Brazil and Mexico benefitted from being relatively safe markets to invest in during the uncertain global environment since the war in Ukraine and the resulting energy crisis in Europe and attracted capital flows that moved out of Russia. According to data from Factset, USD 15.7 billion of capital moved into Brazil during the period from January 31st to March 8th, and Brazil’s weight in the FTSE Emerging All Cap Index increased to 6.8% on March 8th from 6.4% on March 4th (FTSE Russell deleted Russia from all its equity indices effective March 7th, given the sanctions on Russia). Both active and passive investment strategies were likely to have steered assets under management from Russia into Brazil, helping the currency pick up steam earlier in the year.
The Brazilian real could continue to show resilience, considering the double-digit interest rates and the cooling-down inflation within the country have made it one of the few with positive real interest rates, in sharp contrast with the negative real rates still seen in most developed and other emerging economies. Although a relatively high economic growth outlook in the longer term may also support the currency value, the uncertainty of the Presidential election in October could pose some short-term currency risks.
For more on high yield, fixed income and other asset classes, subscribe to the blog.
—
Originally Posted October 28, 2022 – Why did the Brazilian Real and Mexican Peso outperform the super-strong US dollar this year?
Disclosure: FTSE Russell
Interactive Advisors, a division of Interactive Brokers Group, offers FTSE Russell Index Tracker portfolios on its online investing marketplace. Learn more about the Diversified Portfolios.
This material is not intended as investment advice. Interactive Advisors or portfolio managers on its marketplace may hold long or short positions in the companies mentioned through stocks, options or other securities.
© 2023 London Stock Exchange Group plc and its applicable group undertakings (the “LSE Group”). The LSE Group includes (1) FTSE International Limited (“FTSE”), (2) Frank Russell Company (“Russell”), (3) FTSE Global Debt Capital Markets Inc. and FTSE Global Debt Capital Markets Limited (together, “FTSE Canada”), (4) MTSNext Limited (“MTSNext”), (5) Mergent, Inc. (“Mergent”), (6) FTSE Fixed Income LLC (“FTSE FI”), (7) The Yield Book Inc (“YB”) and (8) Beyond Ratings S.A.S. (“BR”). All rights reserved.
FTSE Russell® is a trading name of FTSE, Russell, FTSE Canada, MTSNext, Mergent, FTSE FI, YB and BR. “FTSE®”, “Russell®”, “FTSE Russell®”, “MTS®”, “FTSE4Good®”, “ICB®”, “Mergent®”, “The Yield Book®”, “Beyond Ratings®“ and all other trademarks and service marks used herein (whether registered or unregistered) are trademarks and/or service marks owned or licensed by the applicable member of the LSE Group or their respective licensors and are owned, or used under licence, by FTSE, Russell, MTSNext, FTSE Canada, Mergent, FTSE FI, YB or BR. FTSE International Limited is authorised and regulated by the Financial Conduct Authority as a benchmark administrator.
All information is provided for information purposes only. All information and data contained in this publication is obtained by the LSE Group, from sources believed by it to be accurate and reliable. Because of the possibility of human and mechanical error as well as other factors, however, such information and data is provided “as is” without warranty of any kind. No member of the LSE Group nor their respective directors, officers, employees, partners or licensors make any claim, prediction, warranty or representation whatsoever, expressly or impliedly, either as to the accuracy, timeliness, completeness, merchantability of any information or of results to be obtained from the use of the FTSE Russell products, including but not limited to indexes, data and analytics or the fitness or suitability of the FTSE Russell products for any particular purpose to which they might be put. Any representation of historical data accessible through FTSE Russell products is provided for information purposes only and is not a reliable indicator of future performance.
No responsibility or liability can be accepted by any member of the LSE Group nor their respective directors, officers, employees, partners or licensors for (a) any loss or damage in whole or in part caused by, resulting from, or relating to any error (negligent or otherwise) or other circumstance involved in procuring, collecting, compiling, interpreting, analysing, editing, transcribing, transmitting, communicating or delivering any such information or data or from use of this document or links to this document or (b) any direct, indirect, special, consequential or incidental damages whatsoever, even if any member of the LSE Group is advised in advance of the possibility of such damages, resulting from the use of, or inability to use, such information.
No member of the LSE Group nor their respective directors, officers, employees, partners or licensors provide investment advice and nothing contained herein or accessible through FTSE Russell products, including statistical data and industry reports, should be taken as constituting financial or investment advice or a financial promotion.
Past performance is no guarantee of future results. Charts and graphs are provided for illustrative purposes only. Index returns shown may not represent the results of the actual trading of investable assets. Certain returns shown may reflect back-tested performance. All performance presented prior to the index inception date is back-tested performance. Back-tested performance is not actual performance, but is hypothetical. The back-test calculations are based on the same methodology that was in effect when the index was officially launched. However, back- tested data may reflect the application of the index methodology with the benefit of hindsight, and the historic calculations of an index may change from month to month based on revisions to the underlying economic data used in the calculation of the index.
This document may contain forward-looking assessments. These are based upon a number of assumptions concerning future conditions that ultimately may prove to be inaccurate. Such forward-looking assessments are subject to risks and uncertainties and may be affected by various factors that may cause actual results to differ materially. No member of the LSE Group nor their licensors assume any duty to and do not undertake to update forward-looking assessments.
No part of this information may be reproduced, stored in a retrieval system or transmitted in any form or by any means, electronic, mechanical, photocopying, recording or otherwise, without prior written permission of the applicable member of the LSE Group. Use and distribution of the LSE Group data requires a licence from FTSE, Russell, FTSE Canada, MTSNext, Mergent, FTSE FI, YB, BR and/or their respective licensors.
Disclosure: Interactive Brokers
Information posted on IBKR Campus that is provided by third-parties does NOT constitute a recommendation that you should contract for the services of that third party. Third-party participants who contribute to IBKR Campus are independent of Interactive Brokers and Interactive Brokers does not make any representations or warranties concerning the services offered, their past or future performance, or the accuracy of the information provided by the third party. Past performance is no guarantee of future results.
This material is from FTSE Russell and is being posted with its permission. The views expressed in this material are solely those of the author and/or FTSE Russell and Interactive Brokers is not endorsing or recommending any investment or trading discussed in the material. This material is not and should not be construed as an offer to buy or sell any security. It should not be construed as research or investment advice or a recommendation to buy, sell or hold any security or commodity. This material does not and is not intended to take into account the particular financial conditions, investment objectives or requirements of individual customers. Before acting on this material, you should consider whether it is suitable for your particular circumstances and, as necessary, seek professional advice.
Disclosure: Forex
There is a substantial risk of loss in foreign exchange trading. The settlement date of foreign exchange trades can vary due to time zone differences and bank holidays. When trading across foreign exchange markets, this may necessitate borrowing funds to settle foreign exchange trades. The interest rate on borrowed funds must be considered when computing the cost of trades across multiple markets.
Disclosure: Futures Trading
Futures are not suitable for all investors. The amount you may lose may be greater than your initial investment. Before trading futures, please read the CFTC Risk Disclosure. A copy and additional information are available at ibkr.com.


