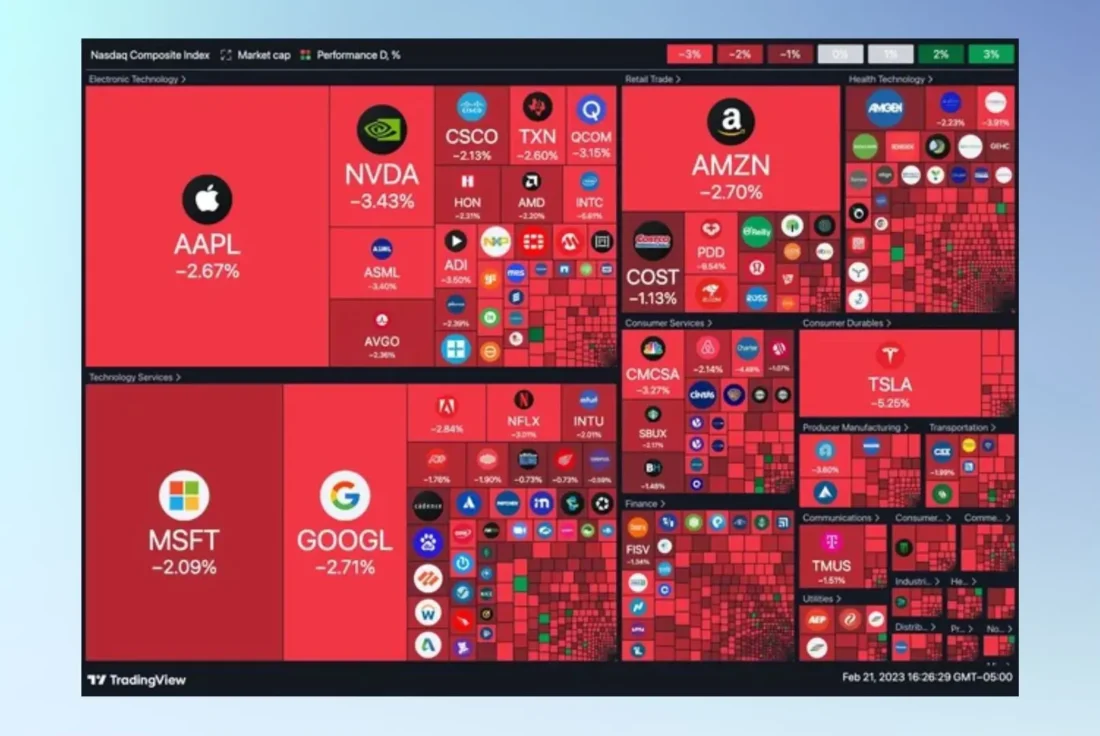
TLDR: The stock market dropped hard after Friday’s option expiry. Once spec shorts were wiped out of the way by the mini-short squeeze (hi Carl!), the market could resume its natural trend. Down.

When PPI printed hot last week, markets were given sufficient reason to sell – at least if you go by the hyper-sensitivity to inflationary pressures we experienced since 2022.
But fall the markets did not … at least until Monday. Why?
Because of speculators and what we call ‘positioning’.
In the last few weeks a number of hedge funds and individual investors had been entering bearish trades in expectation of a drop in S&P 500 for a variety of reasons
Some felt the market was high in the range, some noted P/E was an obscene 18x, some believed PPI would bring down the house. Some just want to see the world burn. To each their own.
The issue is that when a lot of people deploy speculative positions in one direction at the same time, they tend to provide support to price action in the opposite direction.
That’s when we say that ‘positioning’ is stretched.
The reason is that speculators have tight stop losses. When a lot of specs are all one-side of the market, the first that begins to cut positions causes an adverse move in price for all others, who begin to cut in turn and…you see where this goes.
So last week the market needed to clear up all the bearish positions, which unsurprisingly congregated on the 3rd Friday expiry. Once those were out of the way, the market begun to price more ‘fundamentally’.
This brings us to another key point, for all short-term traders: watch out for the 3rd Friday of the month.
That’s when major options expire and it can always be a funky time, as it’s where speculative option trades tend to fade out of the market.
What stocks are doing well today?
This section is powered by Open AI connected to TOGGLE AI
At pixel time, the median pre-open performance for S&P 500 stocks is -0.0759%, indicating that 30% of stocks in the SPX index are down pre-open.
Taking a deeper look into the market, stocks that are up show a high number of analyst SELL recommendations (26.0% of all rising stocks) as well as high expectations for earnings growth (20.0%) and a high number of analyst BUY recommendations (19.0%). The top 5 gainers at this time were LMT:NYSE 1.21%, K:NYSE 1.38%, SEDG:NASD 1.46%, EL:NYSE 1.73%, and AMT:NYSE 3.42%.
Conversely, stocks that pre-opened down are characterised by low trading volume (87.0% of all falling stocks), sales that have surprised on the downside (62.0%), and weak earnings growth (45.0%). The top 5 losers were TRGP:NYSE -4.45%, VFC:NYSE -1.45%, WYNN:NASD -1.34%, FTNT:NASD -1.31%, and MRNA:NASD -1.26%.
TOGGLE Leading Indicators: Leading indicators tilt bearish
After yesterday’s drop, we see the first signs of inversion with the Trough indicator flashing bullish:
- TLI: began flashing red two weeks ago now, now it retraced into neutral
- Rangefinder Index: posted another bearish transition last Friday
- Peak Probability Indicator: still not active, nearing the 95% threshold
- Trough Probability Indicator: There comes the first bullish signal
- Candle Breadth: reached the bearish threshold again last week
- Market Phase Shift Indicator: still not active, this is a longer-term indicator
Learn more about the Leading Indicators in the Learn Center!


Upcoming Earnings: Alibaba Group releases tomorrow


Click here to test what to expect when BABA releases earnings tomorrow.
Discover how other companies could react post earnings with the help of TOGGLE’s WhatIF Earnings tool.
Asset Spotlight: Snap out of it!
TOGGLE analyzed 7 similar occasions in the past where technical analysis indicators for Snap rose and historically this led to a median increase in the stock price over the following 6M. Check it out!


General Interest: Poof go $42M
Can a porcelain balloon dog really be worth $42M? Well, yes if you can convince the next person to buy it for even more. Contemporary art shares a lot of traits with other non fungible bubble markets like crypto and tulips.
A coterie of art brokerages makes a living by justifying rising prices for expensive masterpieces – leading to cases like this erstwhile porcelain dog worth more than a Manhattan penthouse.
Be it as it may, the sheer destruction of value does leave one baffled if one of these works is shattered, like it happened 2 days ago in Miami.
Apparently an art collector got somehow personal and clumsy with the artwork and poof no more statuette.
Luckily insurance covered the whole cost. One can even imagine that in this age of destructive performance the shards might well be worth something.
Read more here.
—
Originally Posted February 22, 2023 – Why the drop
Disclosure: Toggle AI
IB Global Investments LLC, a subsidiary of Interactive Broker Group Inc., the parent company of Interactive Brokers LLC, is a minority owner of Toggle AI.
Disclosure: Interactive Brokers
Information posted on IBKR Campus that is provided by third-parties does NOT constitute a recommendation that you should contract for the services of that third party. Third-party participants who contribute to IBKR Campus are independent of Interactive Brokers and Interactive Brokers does not make any representations or warranties concerning the services offered, their past or future performance, or the accuracy of the information provided by the third party. Past performance is no guarantee of future results.
This material is from Toggle AI and is being posted with its permission. The views expressed in this material are solely those of the author and/or Toggle AI and Interactive Brokers is not endorsing or recommending any investment or trading discussed in the material. This material is not and should not be construed as an offer to buy or sell any security. It should not be construed as research or investment advice or a recommendation to buy, sell or hold any security or commodity. This material does not and is not intended to take into account the particular financial conditions, investment objectives or requirements of individual customers. Before acting on this material, you should consider whether it is suitable for your particular circumstances and, as necessary, seek professional advice.
Disclosure: Options Trading
Options involve risk and are not suitable for all investors. Multiple leg strategies, including spreads, will incur multiple commission charges. For more information read the "Characteristics and Risks of Standardized Options" also known as the options disclosure document (ODD) or visit ibkr.com/occ


![[Gamma] Scalping Please [Gamma] Scalping Please](https://ibkrcampus.com/wp-content/smush-webp/2024/04/tir-featured-8-700x394.jpg.webp)
![[Gamma] Scalping Please [Gamma] Scalping Please](https://ibkrcampus.com/wp-content/uploads/2024/04/tir-featured-8-700x394.jpg)


![[Gamma] Scalping Please [Gamma] Scalping Please](https://ibkrcampus.com/wp-content/smush-webp/2024/04/tir-featured-8-300x169.jpg.webp)
![[Gamma] Scalping Please [Gamma] Scalping Please](https://ibkrcampus.com/wp-content/uploads/2024/04/tir-featured-8-300x169.jpg)