


Today is a fairly momentous day in the world of fixed income. As of this morning, the entire US Treasury yield curve is above 4%. We’ve noted that markets love round numbers – it’s human nature – but the number itself rarely tells the whole story. The importance of a given number is less important than the context behind it. In the case of yields, the context is that they have been rising sharply and steadily over the past month. The following graph demonstrates the jump in yields across the curve:
US Treasury Actives Yield Curve, Today (green, top), 1 Month Ago (orange, top); with Changes in Basis Points (bottom bars)
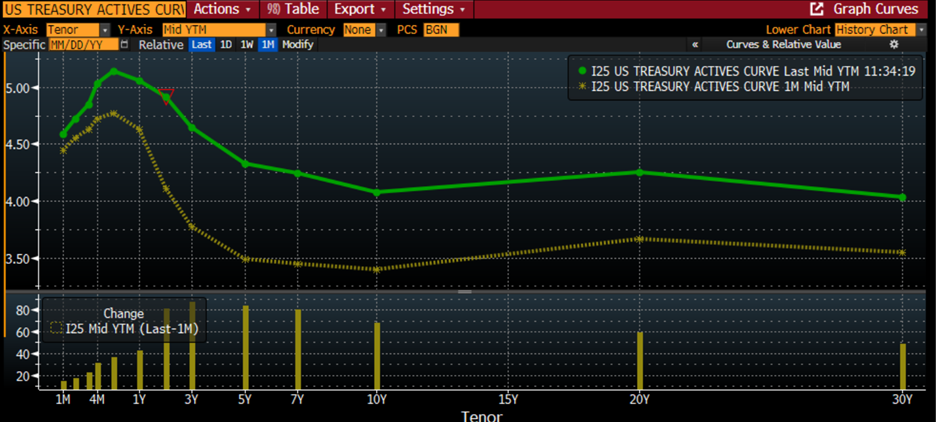
Source: Bloomberg
Financial media duly reported the yield curve phenomenon, spurred by yet another rise in note and bond yields this morning. Yet as I write this, stocks are continuing their relatively blasé approach to the changing rate environment. Earlier this week, we noted that stock moves in February were relatively muted, as the chart below shows:
1-Month Chart, 10-Minute Bars, S&P 500 (SPX, red/green), NASDAQ 100 (NDX, blue)
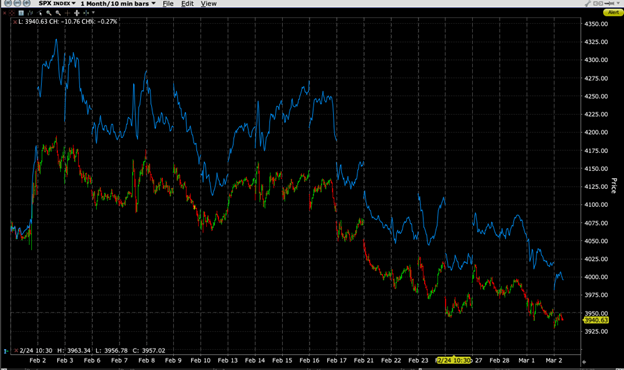
Source: Interactive Brokers
The other day, a friend bemoaned equities’ general lack of movement in February and expressed concern over their lack of movement. I pushed back at him, saying that the stock market’s performance over the month was remarkably good considering the backup in yields and persistently higher inflation reports. The bigger question is how can stock traders remain relatively sanguine as their fixed income counterparts run to the exits?
I offer the following theories:
- Institutions have sufficiently de-risked their portfolios to the point where they can remain relatively unconcerned. If institutional investors are underweight equities and overweight cash, they may not feel compelled to sell more stocks or clamor for protection.
- That may also explain why VIX seems to be mired around the 20 level. If an investor feels relatively protected, they have little demand for volatility protection.
- As we noted the other day, it means that the “pain trade” might be to the upside. Institutional investors are highly susceptible to FOMO, especially if they are underweight and risk missing their benchmarks.
- Quite frankly, stocks can ignore bonds for extended periods of time. I began my career at Salomon Brothers in 1987. Stock traders were ebullient, with equities moving higher seemingly every day, while the bond traders showed bear market gloom. This went on for months, until of course it reversed scarily. To be sure, I say this for illustration, not because we have reached those sorts of extremes. But the relationship between stocks and bonds can be tenuous in the short- or even intermediate-term. Equity valuations tend to rely on discounted cash flows, and higher rates reduce the present value of those flows. Yet for the same reason that I find myself occasionally eating too much pizza even as I attempt to maintain a healthy diet, stock traders can become fixated on compelling narratives or momentum at the expense of valuation discipline.
- Stocks are at level where they are receiving a considerable amount of technical support. The chart below shows that SPX is perched around its 100-day and 200-day moving averages and a key trendline that has been supportive since October:
SPX 1-Year Daily Bars with 100-Day (yellow) and 200-Day (purple) Moving Averages
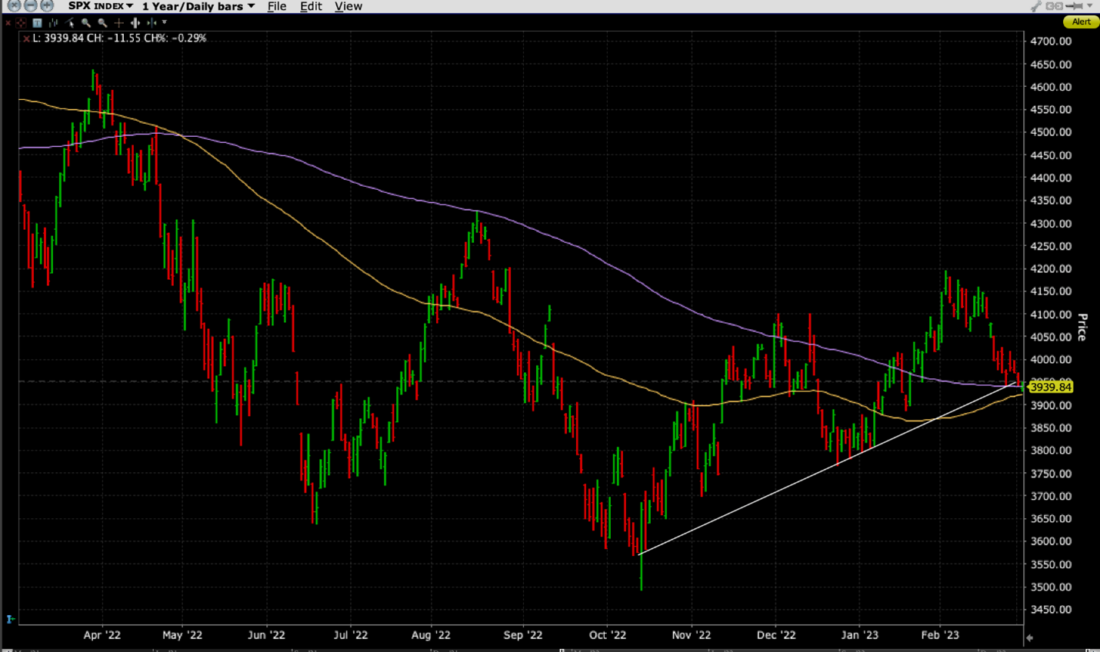
Source: Interactive Brokers
The risk here is what might happen if the support breaks. A quick move to 3,800 would hardly be out of the question, and any uptrend would immediately become flatter and more tenuous.
There is no single reason why stocks might remain relatively unconcerned with the recent bump in interest rates. It may be as simple as the notion that traders aren’t fully finished with the risk-on sentiment that we have seen since January. But if the bullish argument is based strictly on technical support and key index levels, those can be quite fragile.
Disclosure: Interactive Brokers
The analysis in this material is provided for information only and is not and should not be construed as an offer to sell or the solicitation of an offer to buy any security. To the extent that this material discusses general market activity, industry or sector trends or other broad-based economic or political conditions, it should not be construed as research or investment advice. To the extent that it includes references to specific securities, commodities, currencies, or other instruments, those references do not constitute a recommendation by IBKR to buy, sell or hold such investments. This material does not and is not intended to take into account the particular financial conditions, investment objectives or requirements of individual customers. Before acting on this material, you should consider whether it is suitable for your particular circumstances and, as necessary, seek professional advice.
The views and opinions expressed herein are those of the author and do not necessarily reflect the views of Interactive Brokers, its affiliates, or its employees.

